Simplification is the key - Centre for Policy Studies
Simplification is the key - Centre for Policy Studies
Simplification is the key - Centre for Policy Studies

You also want an ePaper? Increase the reach of your titles
YUMPU automatically turns print PDFs into web optimized ePapers that Google loves.
savings by delivering a framework that <strong>is</strong> simple and flexible, permitting savers to make<br />
lifestyle choices with certainty. The recent Coalition Agreement (May 2010) does refer to<br />
ending compulsory annuit<strong>is</strong>ation.<br />
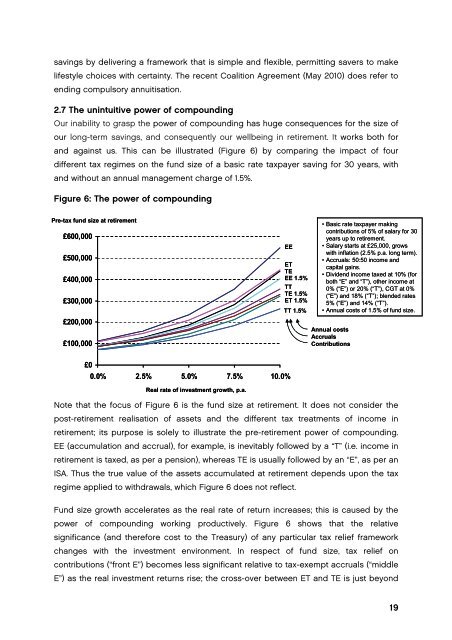
2.7 The unintuitive power of compounding<br />
Our inability to grasp <strong>the</strong> power of compounding has huge consequences <strong>for</strong> <strong>the</strong> size of<br />
our long-term savings, and consequently our wellbeing in retirement. It works both <strong>for</strong><br />
and against us. Th<strong>is</strong> can be illustrated (Figure 6) by comparing <strong>the</strong> impact of four<br />
different tax regimes on <strong>the</strong> fund size of a basic rate taxpayer saving <strong>for</strong> 30 years, with<br />
and without an annual management charge of 1.5%.<br />
Figure 6: The power of compounding<br />
Pre-tax fund size at retirement<br />
£600,000<br />
£500,000<br />
£400,000<br />
£300,000<br />
£200,000<br />
£100,000<br />
EE<br />
ET<br />
TE<br />
EE 1.5%<br />
TT<br />
TE 1.5%<br />
ET 1.5%<br />
TT 1.5%<br />
• Basic rate taxpayer making<br />
contributions of 5% of salary <strong>for</strong> 30<br />
years up to retirement.<br />
• Salary starts at £25,000, grows<br />
with inflation (2.5% p.a. long term).<br />
• Accruals: 50:50 income and<br />
capital gains.<br />
• Dividend income taxed at 10% (<strong>for</strong><br />
both “E” and “T”), o<strong>the</strong>r income at<br />
0% (“E”) or 20% (“T”), CGT at 0%<br />
(“E”) and 18% (“T”); blended rates<br />
5% (“E”) and 14% (“T”).<br />
• Annual costs of 1.5% of fund size.<br />
Annual costs<br />
Accruals<br />
Contributions<br />
£0<br />
0.0% 2.5% 5.0% 7.5% 10.0%<br />
Real rate of investment growth, p.a.<br />
Note that <strong>the</strong> focus of Figure 6 <strong>is</strong> <strong>the</strong> fund size at retirement. It does not consider <strong>the</strong><br />
post-retirement real<strong>is</strong>ation of assets and <strong>the</strong> different tax treatments of income in<br />
retirement; its purpose <strong>is</strong> solely to illustrate <strong>the</strong> pre-retirement power of compounding.<br />
EE (accumulation and accrual), <strong>for</strong> example, <strong>is</strong> inevitably followed by a “T” (i.e. income in<br />
retirement <strong>is</strong> taxed, as per a pension), whereas TE <strong>is</strong> usually followed by an “E”, as per an<br />
ISA. Thus <strong>the</strong> true value of <strong>the</strong> assets accumulated at retirement depends upon <strong>the</strong> tax<br />
regime applied to withdrawals, which Figure 6 does not reflect.<br />
Fund size growth accelerates as <strong>the</strong> real rate of return increases; th<strong>is</strong> <strong>is</strong> caused by <strong>the</strong><br />
power of compounding working productively. Figure 6 shows that <strong>the</strong> relative<br />
significance (and <strong>the</strong>re<strong>for</strong>e cost to <strong>the</strong> Treasury) of any particular tax relief framework<br />
changes with <strong>the</strong> investment environment. In respect of fund size, tax relief on<br />
contributions (“front E”) becomes less significant relative to tax-exempt accruals (“middle<br />
E”) as <strong>the</strong> real investment returns r<strong>is</strong>e; <strong>the</strong> cross-over between ET and TE <strong>is</strong> just beyond<br />
19