Tohopekaliga Water Authority Investment Report - Quarter Ended December 31, 2010Executive SummaryPORTFOLIO STRATEGY‣ The Authority’s Impact Fee and Operating portfolios are of high credit quality and maintain adequate liquidity. The portfolios are invested entirely inFederal Agency, U.S. Treasury, Commercial Paper and FDIC guaranteed corporate securities. The securities are allocated among high quality issuersrated AAA and A-1+.‣ Intermediate-term Treasury yields declined <strong>to</strong> record lows over the quarter. Two-year U.S. Treasury rates closed at 0.33% in early November, spurredby the announcement of a second round of quantitative easing (“QE2”) by the Federal Reserve at its November 3 rd FOMC meeting. The Fed <strong>called</strong> foran additional $6<strong>00</strong> billion in longer-term Treasury purchases through June <strong>2011</strong> in an attempt <strong>to</strong> reduce corporate, consumer, and mortgage borrowingrates, thus stimulating economic growth through corporate investment and support for the housing sec<strong>to</strong>r. By the end of the fourth quarter of 2010, theFed had purchased nearly $168 billion in Treasury securities.‣ By the end of the quarter, intermediate-term yields increased sharply from record lows in early November, but remained well below long-term his<strong>to</strong>ricalaverages. The yield increases were due in part <strong>to</strong> increased inflation expectations as a result of QE2, as well as the extension of the Bush-era tax cuts,which will add an additional $858 billion <strong>to</strong> the economy over two years. The two-year U.S. Treasury yield ended the quarter at 0.59%, closing 0.17%higher than it opened.‣ Overall economic conditions appear <strong>to</strong> be improving. For example, third quarter GDP was <strong>2.</strong>6%, a substantial improvement over second quarter GDP.However this level of growth remains insufficient <strong>to</strong> impact the problematically high unemployment rate. Nonetheless, the unemployment rate was9.4% in December, the lowest reading of the year. At the same time, the number of discouraged workers hit a record high 3.1 million – these workersare not counted in the headline unemployment rate.‣ Over the course of the quarter, we were able <strong>to</strong> use active management strategies <strong>to</strong> take advantage of the volatility in yields. In the Impact Fees andOperating portfolios we made several sec<strong>to</strong>r swaps in addition <strong>to</strong> extension trades. For example, in Oc<strong>to</strong>ber we sold federal agency and Treasurysecurities in the two month- <strong>to</strong> one-year maturity range and targeted purchases in the three-year area – this strategy resulted in realizing over $62,<strong>00</strong>0in gains on sales. The Portfolios realized over $295,<strong>00</strong>0 in gains on sales during the quarter.‣ At the beginning of the quarter, we targeted the Impact Fee and Operating portfolios’ durations at 78-82% of the benchmark’s duration in <strong>order</strong> <strong>to</strong>benefit from the yield and roll down offered by the steep yield curve. Over the quarter, as rates increased and the yield curve steepened further, weextended the durations of the portfolios closer <strong>to</strong> the benchmarks’ duration. The Impact Fee Portfolio’s return of -0.12%, outperformed the benchmark’sreturn of -0.15% by 3 basis points (0.03%). The Operating Portfolio’s return of -0.15%, performed in line with the benchmark’s return of -0.15%. Theextension trades were done in Oc<strong>to</strong>ber and November <strong>to</strong> take advantage of rising rates. However, when Congress passed the Fiscal Stimulus packagein mid-December rates continued <strong>to</strong> rise resulting in the Portfolios’ <strong>to</strong>tal return performances <strong>to</strong> be negative for the quarter.‣ PFM will continue <strong>to</strong> follow the prudent investment strategies that have safely provided the Authority with favorable long-term performance during thisperiod of his<strong>to</strong>ric low interest rates.‣ Rates have bounced back from all-time lows, but remain depressed from a his<strong>to</strong>rical standpoint. The Fed is signaling that it plans <strong>to</strong> continue <strong>to</strong> keeprates low for an extended period. As such, we will position the portfolios’ duration close <strong>to</strong> the benchmark’s duration in <strong>order</strong> <strong>to</strong> capitalize on addedyield and roll down. We will closely moni<strong>to</strong>r the markets <strong>to</strong> make select purchases of securities when rates move <strong>to</strong>wards the upper end of their range.‣ Agency spreads over Treasuries continue <strong>to</strong> be compressed. We will allocate about 35-40% of the portfolios <strong>to</strong> Treasuries. In the case that spreadswiden, Treasuries could outperform agencies. At that point, we will restructure the portfolios, allocating a larger portion <strong>to</strong> agency securities.PFM Asset Management LLC Section B - 1
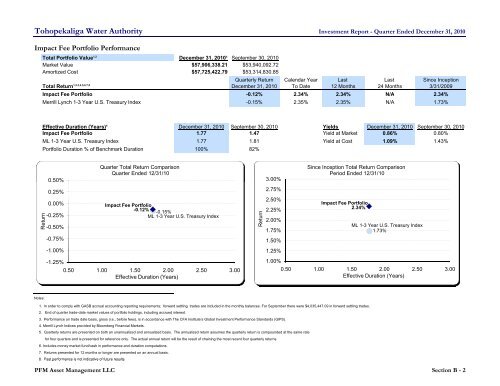
Tohopekaliga Water Authority Investment Report - Quarter Ended December 31, 2010Impact Fee Portfolio PerformanceTotal Portfolio Value 1,2 December 31, 2010¹ September 30, 2010Market Value $57,906,338.21 $53,940,09<strong>2.</strong>72Amortized Cost $57,725,42<strong>2.</strong>79 $53,314,830.85Quarterly Return Calendar Year Last Last Since InceptionTotal Return 1,2,3,4,5,6,7,8 December 31, 2010 To Date 12 Months 24 Months 3/31/2<strong>00</strong>9Impact Fee Portfolio -0.12% <strong>2.</strong>34% <strong>2.</strong>34% N/A <strong>2.</strong>34%Merrill Lynch 1-3 Year U.S. Treasury Index -0.15% <strong>2.</strong>35% <strong>2.</strong>35% N/A <strong>1.</strong>73%Effective Duration (Years) 4 December 31, 2010 September 30, 2010 Yields December 31, 2010 September 30, 2010Impact Fee Portfolio <strong>1.</strong>77 <strong>1.</strong>47 Yield at Market 0.86% 0.80%ML 1-3 Year U.S. Treasury Index <strong>1.</strong>77 <strong>1.</strong>81 Yield at Cost <strong>1.</strong>09% <strong>1.</strong>43%Portfolio Duration % of Benchmark Duration 1<strong>00</strong>% 82%ReturnQuarter Total Return ComparisonQuarter Ended 12/31/1<strong>00</strong>.50%0.25%0.<strong>00</strong>%-0.25%-0.50%Impact Fee Portfolio-0.12% -0.15%ML 1-3 Year U.S. Treasury Index-0.75%-<strong>1.</strong><strong>00</strong>%-<strong>1.</strong>25%0.50 <strong>1.</strong><strong>00</strong> <strong>1.</strong>50 <strong>2.</strong><strong>00</strong> <strong>2.</strong>50 3.<strong>00</strong>Effective Duration (Years)ReturnSince Inception Total Return ComparisonPeriod Ended 12/31/103.<strong>00</strong>%<strong>2.</strong>75%<strong>2.</strong>50%<strong>2.</strong>25%<strong>2.</strong><strong>00</strong>%<strong>1.</strong>75%Impact Fee Portfolio<strong>2.</strong>34%ML 1-3 Year U.S. Treasury Index<strong>1.</strong>73%<strong>1.</strong>50%<strong>1.</strong>25%<strong>1.</strong><strong>00</strong>%0.50 <strong>1.</strong><strong>00</strong> <strong>1.</strong>50 <strong>2.</strong><strong>00</strong> <strong>2.</strong>50 3.<strong>00</strong>Effective Duration (Years)Notes:<strong>1.</strong> In <strong>order</strong> <strong>to</strong> comply with GASB accrual accounting reporting requirements; forward settling trades are included in the monthly balances. For September there were $4,035,447.09 in forward settling trades.<strong>2.</strong> End of quarter trade-date market values of portfolio holdings, including accrued interest.3. Performance on trade date basis, gross (i.e., before fees), is in accordance with The CFA Institute’s Global Investment Performance Standards (GIPS).4. Merrill Lynch Indices provided by Bloomberg Financial Markets.5. Quarterly returns are presented on both an unannualized and annualized basis. The annualized return assumes the quarterly return is compounded at the same ratefor four quarters and is presented for reference only. The actual annual return will be the result of chaining the most recent four quarterly returns.6. Includes money market fund/cash in performance and duration computations.7. Returns presented for 12 months or longer are presented on an annual basis.8. Past performance is not indicative of future results.PFM Asset Management LLC Section B - 2


