1 Introduction and Background1.1 Importance of Build<strong>in</strong>g <strong>Energy</strong> CodesBuild<strong>in</strong>g energy codes are a proven and cost-effective means of improv<strong>in</strong>g energyefficiency <strong>in</strong> new build<strong>in</strong>gs (IEA 2007). Build<strong>in</strong>gs account for about one-third of energyconsumption globally and <strong>in</strong> <strong>the</strong> APP countries 1 . Several APP countries are experienc<strong>in</strong>ghigh rates of growth <strong>in</strong> new build<strong>in</strong>gs, particularly Ch<strong>in</strong>a and India. Ch<strong>in</strong>a, for example,will likely account for 50% of all new build<strong>in</strong>g space <strong>in</strong> <strong>the</strong> world through 2020. Becausemost of <strong>the</strong> energy “footpr<strong>in</strong>t” of a build<strong>in</strong>g is set with its <strong>in</strong>itial design, build<strong>in</strong>g energycodes provide essential leverage for improv<strong>in</strong>g build<strong>in</strong>g energy efficiency. In <strong>the</strong> UnitedStates, for example, <strong>the</strong> U.S. Department of <strong>Energy</strong>’s Build<strong>in</strong>g <strong>Energy</strong> Codes Program isestimated to have saved $30-50 for every dollar <strong>the</strong> program has spent, thus sav<strong>in</strong>g over$1 billion <strong>in</strong> energy costs <strong>in</strong> a year. This equates to $7 billion <strong>in</strong> energy sav<strong>in</strong>gs <strong>in</strong>residential build<strong>in</strong>gs through 2010 and $3.3 billion <strong>in</strong> energy sav<strong>in</strong>gs <strong>in</strong> commercialbuild<strong>in</strong>gs. 2This report beg<strong>in</strong>s with an overview of <strong>the</strong> build<strong>in</strong>g sectors <strong>in</strong> APP countries. Chapter 2<strong>the</strong>n provides background on <strong>the</strong> history of build<strong>in</strong>g energy codes <strong>in</strong> APP countries,outl<strong>in</strong><strong>in</strong>g <strong>the</strong>ir progress <strong>in</strong> improv<strong>in</strong>g <strong>the</strong>ir build<strong>in</strong>g energy codes and implementationprograms <strong>in</strong> recent decades. Chapter 3 compares <strong>the</strong> specific details of build<strong>in</strong>g energycodes <strong>in</strong> <strong>the</strong> APP region <strong>in</strong>clud<strong>in</strong>g <strong>the</strong> structure of <strong>the</strong> codes, issues <strong>the</strong>y address, and <strong>the</strong>str<strong>in</strong>gency of specific requirements. Chapter 4 highlights how <strong>the</strong> APP countries haveapproached compliance and implementation and covers a range of issues such as <strong>the</strong>enforcement framework, test protocols, compliance tools and public <strong>in</strong>formation. Chapter5 provides conclusions. The report seeks to provide policy makers and build<strong>in</strong>g energycode officials with <strong>in</strong>sights <strong>in</strong>to successful approaches for a range of build<strong>in</strong>g energycode issues. In this way, APP countries can learn from each o<strong>the</strong>r as <strong>the</strong>y address <strong>the</strong>challenges of improv<strong>in</strong>g energy efficiency <strong>in</strong> new build<strong>in</strong>gs to address grow<strong>in</strong>g concernsabout climate change and energy security.1.2 Economics, <strong>Energy</strong> and Carbon EmissionsThe seven APP countries accounted for 45% of <strong>the</strong> world’s population (<strong>in</strong> 2007), 48% ofits gross domestic product (GDP) 3 , 51% of its primary energy consumption (<strong>in</strong> 2005) and54% of its carbon dioxide emissions (<strong>in</strong> 2005). Four APP countries (<strong>the</strong> United States,Ch<strong>in</strong>a, Japan and India) are among <strong>the</strong> world’s top five world economies, and are among<strong>the</strong> largest primary energy consumers and carbon emitters (Table 1).1 The Asia-Pacific Partnership for Clean Development and Climate <strong>in</strong>cludes seven countries: Australia,Canada, Ch<strong>in</strong>a, Japan, South Korea, India and <strong>the</strong> United States.2 For more <strong>in</strong>formation, please see http://www.energycodes.gov/whatwedo/<strong>in</strong>dex.stm.3 The GDP is <strong>in</strong> purchas<strong>in</strong>g power parity (PPP) for 2007.14
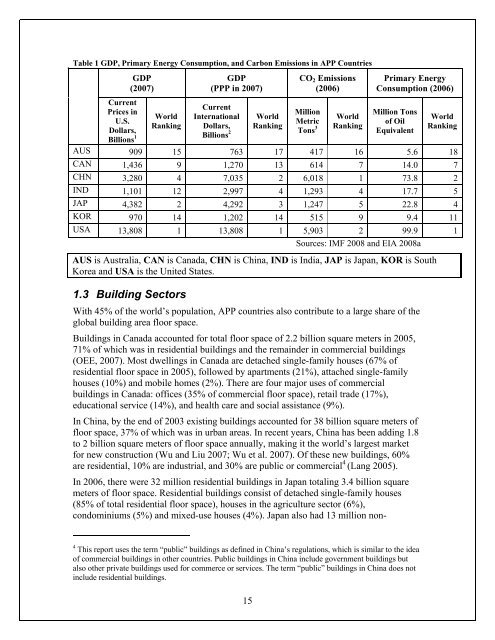
Table 1 GDP, Primary <strong>Energy</strong> Consumption, and Carbon Emissions <strong>in</strong> APP CountriesGDP(2007)GDP(PPP <strong>in</strong> 2007)CO 2 Emissions(2006)Primary <strong>Energy</strong>Consumption (2006)CurrentCurrentPrices <strong>in</strong>MillionMillion TonsWorld International WorldWorldWorldU.S.Metricof OilRank<strong>in</strong>g Dollars, Rank<strong>in</strong>gDollars,Billions 1Billions 2Tons 3 Rank<strong>in</strong>gRank<strong>in</strong>gEquivalentAUS 909 15 763 17 417 16 5.6 18CAN 1,436 9 1,270 13 614 7 14.0 7CHN 3,280 4 7,035 2 6,018 1 73.8 2IND 1,101 12 2,997 4 1,293 4 17.7 5JAP 4,382 2 4,292 3 1,247 5 22.8 4KOR 970 14 1,202 14 515 9 9.4 11USA 13,808 1 13,808 1 5,903 2 99.9 1Sources: IMF 2008 and EIA 2008aAUS is Australia, CAN is Canada, CHN is Ch<strong>in</strong>a, IND is India, JAP is Japan, KOR is SouthKorea and USA is <strong>the</strong> United States.1.3 Build<strong>in</strong>g SectorsWith 45% of <strong>the</strong> world’s population, APP countries also contribute to a large share of <strong>the</strong>global build<strong>in</strong>g area floor space.Build<strong>in</strong>gs <strong>in</strong> Canada accounted for total floor space of 2.2 billion square meters <strong>in</strong> 2005,71% of which was <strong>in</strong> residential build<strong>in</strong>gs and <strong>the</strong> rema<strong>in</strong>der <strong>in</strong> commercial build<strong>in</strong>gs(OEE, 2007). Most dwell<strong>in</strong>gs <strong>in</strong> Canada are detached s<strong>in</strong>gle-family houses (67% ofresidential floor space <strong>in</strong> 2005), followed by apartments (21%), attached s<strong>in</strong>gle-familyhouses (10%) and mobile homes (2%). There are four major uses of commercialbuild<strong>in</strong>gs <strong>in</strong> Canada: offices (35% of commercial floor space), retail trade (17%),educational service (14%), and health care and social assistance (9%).In Ch<strong>in</strong>a, by <strong>the</strong> end of 2003 exist<strong>in</strong>g build<strong>in</strong>gs accounted for 38 billion square meters offloor space, 37% of which was <strong>in</strong> urban areas. In recent years, Ch<strong>in</strong>a has been add<strong>in</strong>g 1.8to 2 billion square meters of floor space annually, mak<strong>in</strong>g it <strong>the</strong> world’s largest marketfor new construction (Wu and Liu 2007; Wu et al. 2007). Of <strong>the</strong>se new build<strong>in</strong>gs, 60%are residential, 10% are <strong>in</strong>dustrial, and 30% are public or commercial 4 (Lang 2005).In 2006, <strong>the</strong>re were 32 million residential build<strong>in</strong>gs <strong>in</strong> Japan total<strong>in</strong>g 3.4 billion squaremeters of floor space. Residential build<strong>in</strong>gs consist of detached s<strong>in</strong>gle-family houses(85% of total residential floor space), houses <strong>in</strong> <strong>the</strong> agriculture sector (6%),condom<strong>in</strong>iums (5%) and mixed-use houses (4%). Japan also had 13 million non-4 This report uses <strong>the</strong> term “public” build<strong>in</strong>gs as def<strong>in</strong>ed <strong>in</strong> Ch<strong>in</strong>a’s regulations, which is similar to <strong>the</strong> ideaof commercial build<strong>in</strong>gs <strong>in</strong> o<strong>the</strong>r countries. Public build<strong>in</strong>gs <strong>in</strong> Ch<strong>in</strong>a <strong>in</strong>clude government build<strong>in</strong>gs butalso o<strong>the</strong>r private build<strong>in</strong>gs used for commerce or services. The term “public” build<strong>in</strong>gs <strong>in</strong> Ch<strong>in</strong>a does not<strong>in</strong>clude residential build<strong>in</strong>gs.15
- Page 1 and 2: PNNL-122267Shaping the Energy Effic
- Page 3: Shaping the Energy Efficiency in Ne
- Page 6 and 7: efficient air conditioning system,
- Page 8 and 9: ContentsForeword ..................
- Page 10 and 11: List of TablesTable 1 GDP, Primary
- Page 12 and 13: ForewordBuildings account for about
- Page 16 and 17: esidential buildings in 2006, with
- Page 18 and 19: JAP 1. Criteria for Clients on the
- Page 20 and 21: can significantly increase energy d
- Page 22 and 23: f) South Korea’s building energy
- Page 24 and 25: 2.1 AustraliaIn the past, Australia
- Page 26 and 27: small cities will be pilot of such
- Page 28 and 29: (DCGREUH) issued by the Ministry of
- Page 30 and 31: according to the current codes. Thi
- Page 32 and 33: Table 7 Structural Comparison of Bu
- Page 34 and 35: 3.3 Building EnvelopeKey Findings A
- Page 36 and 37: JAPCCREUH1999KORBDCES2008USAASHRAE9
- Page 38 and 39: This study selects the midpoint sco
- Page 40 and 41: MiamiUSA0.36(Insulationabove deck)t
- Page 42 and 43: Six countries have jurisdictions in
- Page 44 and 45: thermal requirements for roofs, flo
- Page 46 and 47: Figure 6 Maximum U-factors in Resid
- Page 48 and 49: Table 16 HVAC in Japan’s Building
- Page 50 and 51: ItemsService water heating refers t
- Page 52 and 53: Water conservation Canada has manda
- Page 54 and 55: practice (MNECB 1997). India sets m
- Page 56 and 57: Canada and India adopt compliance p
- Page 58 and 59: Japan only supervises the building
- Page 60 and 61: 4.2 Testing and RatingKey Findings
- Page 62 and 63: Other commonly used tools among APP
- Page 64 and 65:
CAN 55MNECH1997CHNINDECBCJAPCanadia
- Page 66 and 67:
and local jurisdiction contact info
- Page 68 and 69:
certifying third-party verifiers or
- Page 70 and 71:
Point of ControlIncentives for Comp
- Page 72 and 73:
Point of ControlIncentives for Comp
- Page 74 and 75:
AUS,continuedCANTesting Agencies an
- Page 76 and 77:
CAN,continuedCHNTesting Agencies an
- Page 78 and 79:
Testing Agencies and Certification
- Page 80 and 81:
USA,continuedTesting Agencies and C
- Page 82 and 83:
Appendix C - Compliance SoftwareAUS
- Page 84 and 85:
CANMNECB1997,continuedSoftwareMetho
- Page 86 and 87:
USAIECC 2006,continuedSoftwareMetho
- Page 88 and 89:
AUSBCA 2007,continuedCANMNECB1997CA
- Page 90 and 91:
JAP,ContinuedKORUSAASHRAE90.1-2007T
- Page 92 and 93:
AcronymsAPPAS/NZSASHRAEAUSBATFBCABD
- Page 94 and 95:
ReferencesABCB (Australian Building
- Page 96 and 97:
IEA (International Energy Agency).
- Page 98:
OEE. 2008. Energy Use Data Handbook