SOIL Report 2008 - ACCESS Development Services
SOIL Report 2008 - ACCESS Development Services
SOIL Report 2008 - ACCESS Development Services

You also want an ePaper? Increase the reach of your titles
YUMPU automatically turns print PDFs into web optimized ePapers that Google loves.
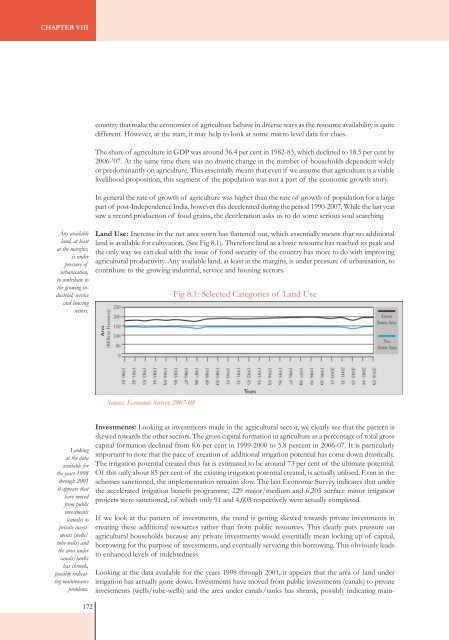
Chapter VIIIcountry that make the economics of agriculture behave in diverse ways as the resource availability is quitedifferent. However, at the start, it may help to look at some macro level data for clues.The share of agriculture in GDP was around 36.4 per cent in 1982-83, which declined to 18.5 per cent by2006-’07. At the same time there was no drastic change in the number of households dependent solelyor predominantly on agriculture. This essentially means that even if we assume that agriculture is a viablelivelihood proposition, this segment of the population was not a part of the economic growth story.In general the rate of growth of agriculture was higher than the rate of growth of population for a largepart of post-Independence India, however this decelerated during the period 1990-2007. While the last yearsaw a record production of food grains, the deceleration asks us to do some serious soul searching.Any availableland, at leastat the margins,is underpressure ofurbanisation,to contribute tothe growing industrial,serviceand housingsectors.Land Use: Increase in the net area sown has flattened out, which essentially means that no additionalland is available for cultivation. (See Fig 8.1). Therefore land as a basic resource has reached its peak andthe only way we can deal with the issue of food security of the country has more to do with improvingagricultural productivity. Any available land, at least at the margins, is under pressure of urbanisation, tocontribute to the growing industrial, service and housing sectors.Fig 8.1: Selected Categories of Land UseSource: Economic Survey 2007-08Lookingat the dataavailable forthe years 1998through 2001it appears thathave movedfrom publicinvestments(canals) toprivate investments(wells/tube-wells) andthe area undercanals/tankshas shrunk,possibly indicatingmaintenanceproblems.Investments: Looking at investments made in the agricultural sector, we clearly see that the pattern isskewed towards the other sectors. The gross capital formation in agriculture as a percentage of total grosscapital formation declined from 8.6 per cent in 1999-2000 to 5.8 percent in 2006-07. It is particularlyimportant to note that the pace of creation of additional irrigation potential has come down drastically.The irrigation potential created thus far is estimated to be around 73 per cent of the ultimate potential.Of this only about 85 per cent of the existing irrigation potential created, is actually utilised. Even in theschemes sanctioned, the implementation remains slow. The last Economic Survey indicates that underthe accelerated irrigation benefit programme, 229 major/medium and 6,205 surface minor irrigationprojects were sanctioned, of which only 91 and 4,605 respectively were actually completed.If we look at the pattern of investments, the trend is getting skewed towards private investments increating these additional resources rather than from public resources. This clearly puts pressure onagricultural households because any private investments would essentially mean locking up of capital,borrowing for the purpose of investments, and eventually servicing this borrowing. This obviously leadsto enhanced levels of indebtedness.Looking at the data available for the years 1998 through 2001, it appears that the area of land underirrigation has actually gone down. Investments have moved from public investments (canals) to privateinvestments (wells/tube-wells) and the area under canals/tanks has shrunk, possibly indicating main-172