SOIL Report 2008 - ACCESS Development Services
SOIL Report 2008 - ACCESS Development Services
SOIL Report 2008 - ACCESS Development Services

You also want an ePaper? Increase the reach of your titles
YUMPU automatically turns print PDFs into web optimized ePapers that Google loves.
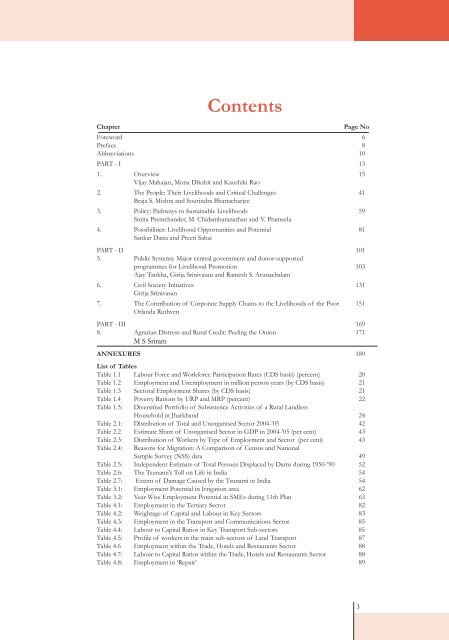
ChapterPage NoForeword 6Preface 8Abbreviations 10Part - I 131. Overview 15Vijay Mahajan, Mona Dikshit and Kaushiki Rao2. The People: Their Livelihoods and Critical Challenges 41Braja S. Mishra and Sourindra Bhattacharjee3. Policy: Pathways to Sustainable Livelihoods 59Smita Premchander, M. Chidambaranathan and V. Prameela4. Possibilities: Livelihood Opportunities and Potential 81Sankar Datta and Preeti SahaiPart - II 1015. Public Systems: Major central government and donor-supportedprogrammes for Livelihood Promotion 103Ajay Tankha, Girija Srinivasan and Ramesh S. Arunachalam6. Civil Society Initiatives 131Girija Srinivasan7. The Contribution of Corporate Supply Chains to the Livelihoods of the Poor 151Orlanda RuthvenPart - III 1698. Agrarian Distress and Rural Credit: Peeling the Onion 171M S SriramAnnexures 189List of TablesTable 1.1 Labour Force and Workforce Participation Rates (CDS basis) (percent) 20Table 1.2 Employment and Unemployment in million person years (by CDS basis) 21Table 1.3 Sectoral Employment Shares (by CDS basis) 21Table 1.4 Poverty Rations by URP and MRP (percent) 22Table 1.5:Diversified Portfolio of Subsistence Activities of a Rural LandlessHousehold in Jharkhand 24Table 2.1: Distribution of Total and Unorganised Sector 2004-’05 42Table 2.2 Estimate Share of Unorganised Sector in Gdp in 2004-’05 (per cent) 43Table 2.3: Distribution of Workers by Type of Employment and Sector (per cent) 43Table 2.4:ContentsReasons for Migration: A Comparison of Census and NationalSample Survey (NSS) data 49Table 2.5: Independent Estimate of Total Persons Displaced by Dams during 1950-’90 52Table 2.6: The Tsunami’s Toll on Life in India 54Table 2.7: Extent of Damage Caused by the Tsunami in India 54Table 3.1: Employment Potential in Irrigation area 62Table 3.2: Year-Wise Employment Potential in SMEs during 11th Plan 63Table 4.1: Employment in the Tertiary Sector 82Table 4.2: Weightage of Capital and Labour in Key Sectors 83Table 4.3: Employment in the Transport and Communications Sector 85Table 4.4: Labour to Capital Ratios in Key Transport Sub-sectors 85Table 4.5: Profile of workers in the main sub-sectors of Land Transport 87Table 4.6 Employment within the Trade, Hotels and Restaurants Sector 88Table 4.7: Labour to Capital Ratios within the Trade, Hotels and Restaurants Sector 88Table 4.8: Employment in ‘Repair’ 893