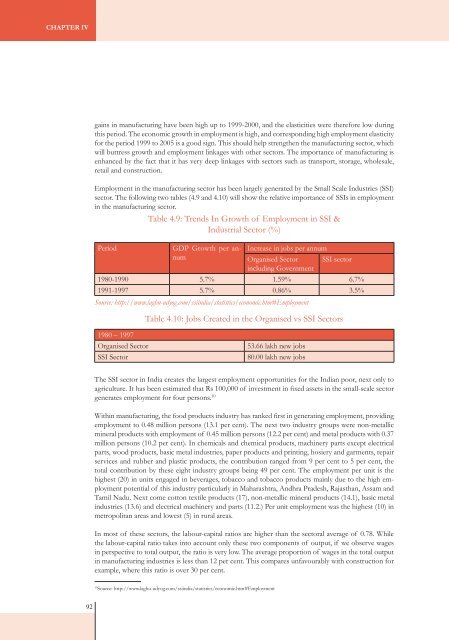
Chapter IVgains in manufacturing have been high up to 1999-2000, and the elasticities were therefore low duringthis period. The economic growth in employment is high, and corresponding high employment elasticityfor the period 1999 to 2005 is a good sign. This should help strengthen the manufacturing sector, whichwill buttress growth and employment linkages with other sectors. The importance of manufacturing isenhanced by the fact that it has very deep linkages with sectors such as transport, storage, wholesale,retail and construction.Employment in the manufacturing sector has been largely generated by the Small Scale Industries (SSI)sector. The following two tables (4.9 and 4.10) will show the relative importance of SSIs in employmentin the manufacturing sector.Table 4.9: Trends In Growth of Employment in SSI &Industrial Sector (%)PeriodGDP Growth per annumIncrease in jobs per annumOrganised Sectorincluding GovernmentSSI sector1980-1990 5.7% 1.59% 6.7%1991-1997 5.7% 0.86% 3.5%Source: http://www.laghu-udyog.com/ssiindia/statistics/economic.htm#EmploymentTable 4.10: Jobs Created in the Organised vs SSI Sectors1980 – 1997Organised SectorSSI Sector53.66 lakh new jobs80.00 lakh new jobsThe SSI sector in India creates the largest employment opportunities for the Indian poor, next only toagriculture. It has been estimated that Rs 100,000 of investment in fixed assets in the small-scale sectorgenerates employment for four persons. 10Within manufacturing, the food products industry has ranked first in generating employment, providingemployment to 0.48 million persons (13.1 per cent). The next two industry groups were non-metallicmineral products with employment of 0.45 million persons (12.2 per cent) and metal products with 0.37million persons (10.2 per cent). In chemicals and chemical products, machinery parts except electricalparts, wood products, basic metal industries, paper products and printing, hosiery and garments, repairservices and rubber and plastic products, the contribution ranged from 9 per cent to 5 per cent, thetotal contribution by these eight industry groups being 49 per cent. The employment per unit is thehighest (20) in units engaged in beverages, tobacco and tobacco products mainly due to the high employmentpotential of this industry particularly in Maharashtra, Andhra Pradesh, Rajasthan, Assam andTamil Nadu. Next come cotton textile products (17), non-metallic mineral products (14.1), basic metalindustries (13.6) and electrical machinery and parts (11.2.) Per unit employment was the highest (10) inmetropolitan areas and lowest (5) in rural areas.In most of these sectors, the labour-capital ratios are higher than the sectoral average of 0.78. Whilethe labour-capital ratio takes into account only these two components of output, if we observe wagesin perspective to total output, the ratio is very low. The average proportion of wages in the total outputin manufacturing industries is less than 12 per cent. This compares unfavourably with construction forexample, where this ratio is over 30 per cent.10Source: http://www.laghu-udyog.com/ssiindia/statistics/economic.htm#Employment92
Possibilities: Livelihood Opportunities and PotentialGiven that manufacturing is a mainstay for stable economic growth, we need to configure solutions suchthat employment in manufacturing also goes up commensurately. In the manufacturing sectors, thereis a need to enhance the labour-capital ratio by adopting more and more labour-intensive productiontechnologies and decentralised systems like the cluster approach for promoting a large number of relatedand support enterprises within a geographical area.8. Given the current share of employment in agriculture, it is not desirableto create more employment in this sectorAgriculture, which has lowest LPPI (see annex Table A.4.1), employs over half the workforce of India.The broad message is that employment in agriculture is near saturation. Even as agriculture cannotsupport fresh livelihoods, the dependence of such a large proportion of workers on agriculture needsattention. This attention has to be in terms of inputs to raise labour productivity and incomes.What annex Table A.4.1 obscures by using agriculture as the base is that the labour productivity inagriculture itself had gone up by around 31 per cent between the 38th and 55th rounds of NSS. Yet,the productivity of agriculture and animal husbandry in India compare very unfavourably with othercountries, and this gap will have to be made up in order to ensure stable and strengthened livelihoodsfor the large numbers dependent on this sector. Any productivity or wage improvements on the marginin agriculture are likely to have a much larger impact than other sectors.In themanufacturingsectors, thereis a needto enhancethe labourcapitalratioby adoptingmore and morelabour-intensiveproductiontechnologies anddecentralisedsystems like thecluster approachfor promotinga large numberof relatedand supportenterpriseswithin ageographicalarea.Given the current share of employment in agriculture, it is not desirable to create more employment inthis sector. Higher employment growth in agriculture will only encourage casual labour and underproductiveemployment. In fact, some of the underproductive labour from agriculture should be divertedto other sectors. Agriculture, like manufacturing, needs to grow and stabilise to enable growth of othersectors, which have a dependence on agriculture for growth of their output, and therefore employment.Transport and storage, as well as business service activities, which offer the second highest opportunityfor supporting livelihoods, are sectors which are dependent on the agriculture and manufacturing sectorsto a great extent. Only when agricultural commodities are produced, or manufactured, they needto be transported and stored.9. Then there are sectors with a high share in total employment but verylow total employment growth rates<strong>Services</strong> such as Community, Social and Personal <strong>Services</strong> which include services in education, health,social services, garbage disposal, defense services, compulsory social security and public administrationrequire huge doses of public sector investment, and are driven largely by the public sector therefore.This sector has a high share of 8.5 per cent in total employment, but very low employment growth rates.While it is desirable for this sector to grow for the universalisation of health and education in particular,just the nature of investment in infrastructure for service provision in these sectors is so prohibitive thatany livelihood promotion initiatives will have to revolve around formal initiatives by the public sector.Electricity, Gas and Water Supply and Mining and Quarrying have negligible LPPIs. Employment growthin these is likely to be for people with high and specialised skills. The large strides that these sectorshave made in terms of productivity, has contributed to poor employment potential and low employmentelasticity in Mining and Quarrying. The high employment elasticity in Electricity, Gas and Water Supplyduring 2000 to 2005 has to do with a very low denominator of GDP growth rate. The high productivityof both sectors coupled with the small share of employment indicates that there is no merit in lookingat these sectors for a livelihood promotion intervention.Electricity, Gasand WaterSupply andMining andQuarryinghave negligibleLPPIs.Employmentgrowth in theseis likely tobe for peoplewith high andspecialisedskills.93
- Page 3 and 4:
State of India’s Livelihoods :The
- Page 5 and 6:
ChapterPage NoForeword 6Preface 8Ab
- Page 8:
ForewordAs a part of its microfinan
- Page 11 and 12:
employment growth, these sectors we
- Page 14:
RIAARMKRRBRSVYSCSC/STsSCPSCSPSERPSE
- Page 20 and 21:
Chapter Iresponse, risks and shocks
- Page 23 and 24:
OverviewTable 1.2 Employment and Un
- Page 25 and 26:
OverviewA recent paper by Arjun Sen
- Page 27:
Overview4. How is the livelihood st
- Page 31 and 32:
Overview5.2 Manmade constraints - i
- Page 33 and 34:
Overviewthe late 1980s, these two m
- Page 35 and 36:
OverviewIn the 1970s, the Chipko mo
- Page 37 and 38:
Overviewsocial responsibility (CSR)
- Page 39 and 40:
OverviewBox 1.3 Bihar - Underdevelo
- Page 42 and 43:
4040
- Page 44 and 45: Chapter IIAn enumeration of the dep
- Page 46 and 47: Chapter IIBox 2.1 Macro Level Livel
- Page 48 and 49: Chapter IIIn addition to the above,
- Page 50 and 51: Chapter IIFig 2.1: Poverty Ratio am
- Page 52 and 53: Chapter IIPoormigrantlabouroften su
- Page 54 and 55: Chapter IIInterestingly, the Govern
- Page 56 and 57: Chapter IIThe effective cost of nat
- Page 58 and 59: Chapter IIsector and thereby casual
- Page 60 and 61: Chapter IIReferences1. Aiyar , Swam
- Page 62 and 63: Chapter IIIto, the vulnerability co
- Page 64 and 65: Chapter IIIIt would be useful here
- Page 66 and 67: Chapter IIIof new employment opport
- Page 68 and 69: Chapter IIIinterest subvention - wo
- Page 70 and 71: Chapter III6. The 11th Plan propose
- Page 72 and 73: Chapter IIIBox 3.5: Rural Business
- Page 74 and 75: Chapter III9. The achievement of ge
- Page 76 and 77: Chapter IIIaid. The Plan also seeks
- Page 78 and 79: Chapter IIIand health. They point o
- Page 80 and 81: Chapter IIIReferences1. Ambasta, Pr
- Page 82 and 83: 8080
- Page 84 and 85: Chapter IVtransport, storage, commu
- Page 86 and 87: Chapter IVing of ‘English Speakin
- Page 88 and 89: Chapter IVWhile these livelihoods h
- Page 90 and 91: Chapter IVTable 4.6 Employment with
- Page 92 and 93: Chapter IVConstruction requires no
- Page 96 and 97: Chapter IV10. A Spatial Perspective
- Page 98 and 99: Chapter IVA quick glance at some of
- Page 100 and 101: Chapter IV12. Once a watershed is d
- Page 102: Chapter IVThrougha range ofschemes
- Page 105 and 106: Public Systems: Major central gover
- Page 107 and 108: Public Systems: Major central gover
- Page 109 and 110: Public Systems: Major central gover
- Page 111 and 112: Public Systems: Major central gover
- Page 113 and 114: Public Systems: Major central gover
- Page 115 and 116: Public Systems: Major central gover
- Page 117 and 118: Public Systems: Major central gover
- Page 119 and 120: Public Systems: Major central gover
- Page 121 and 122: Public Systems: Major central gover
- Page 123 and 124: Public Systems: Major central gover
- Page 125 and 126: Public Systems: Major central gover
- Page 127 and 128: Public Systems: Major central gover
- Page 129 and 130: Public Systems: Major central gover
- Page 131 and 132: Public Systems: Major central gover
- Page 133 and 134: Civil Society InitiativesChapter VI
- Page 135 and 136: Civil Society InitiativesThe human
- Page 137 and 138: Civil Society Initiativesso far has
- Page 139 and 140: Civil Society Initiativesan 8 per c
- Page 141 and 142: Civil Society InitiativesThe cooper
- Page 143 and 144: Civil Society Initiativeslimited ir
- Page 145 and 146:
Civil Society Initiativesintelligen
- Page 147 and 148:
Civil Society InitiativesOutboard M
- Page 149 and 150:
Civil Society InitiativesCase Study
- Page 151 and 152:
Civil Society InitiativesReferences
- Page 153 and 154:
The Contribution of Corporate Suppl
- Page 155 and 156:
The Contribution of Corporate Suppl
- Page 157 and 158:
The Contribution of Corporate Suppl
- Page 159 and 160:
The Contribution of Corporate Suppl
- Page 161 and 162:
The Contribution of Corporate Suppl
- Page 163 and 164:
The Contribution of Corporate Suppl
- Page 165 and 166:
The Contribution of Corporate Suppl
- Page 167 and 168:
The Contribution of Corporate Suppl
- Page 169 and 170:
The Contribution of Corporate Suppl
- Page 172 and 173:
Chapter VIII170
- Page 174 and 175:
Chapter VIIIcountry that make the e
- Page 176 and 177:
Chapter VIIIFig 8.4: All-India area
- Page 178 and 179:
Chapter VIIIWhen commercial crops l
- Page 180 and 181:
Chapter VIIIunit of risk settlement
- Page 182 and 183:
Chapter VIIIPublic capitalformation
- Page 184 and 185:
Chapter VIII8. Integrated Rural Dev
- Page 186 and 187:
Chapter VIIIAn expertpanel ‘sreco
- Page 188 and 189:
Chapter VIIIHowever as final wage s
- Page 190:
188
- Page 193 and 194:
appENDIX TableTable A.1.3: Distribu
- Page 195 and 196:
appENDIX TableEmploymentEmploymentG
- Page 197 and 198:
appENDIX TableTable 2: Employment S
- Page 199 and 200:
appENDIX TableTable 4: State Wise G
- Page 201 and 202:
appENDIX TableTable-7: Distribution
- Page 203 and 204:
appENDIX TableDams and Displacement
- Page 205 and 206:
appENDIX TableFig. A.3.2: High Pote
- Page 207 and 208:
appENDIX TableTable A.3.2Table 2: S
- Page 209 and 210:
appENDIX TableChapter IV - ANNEX TA
- Page 211 and 212:
appENDIX TableAnnex A.5.1Backward R
- Page 213 and 214:
appENDIX TableAnnex A.5.3Some UNDP
- Page 215 and 216:
appENDIX TableGross Value of Output
- Page 217 and 218:
Mona DikshitMona Dikshit has been a