- Page 3 and 4:
State of India’s Livelihoods :The
- Page 5 and 6:
ChapterPage NoForeword 6Preface 8Ab
- Page 8:
ForewordAs a part of its microfinan
- Page 11 and 12:
employment growth, these sectors we
- Page 14:
RIAARMKRRBRSVYSCSC/STsSCPSCSPSERPSE
- Page 20 and 21:
Chapter Iresponse, risks and shocks
- Page 23 and 24:
OverviewTable 1.2 Employment and Un
- Page 25 and 26:
OverviewA recent paper by Arjun Sen
- Page 27:
Overview4. How is the livelihood st
- Page 31 and 32:
Overview5.2 Manmade constraints - i
- Page 33 and 34:
Overviewthe late 1980s, these two m
- Page 35 and 36:
OverviewIn the 1970s, the Chipko mo
- Page 37 and 38:
Overviewsocial responsibility (CSR)
- Page 39 and 40:
OverviewBox 1.3 Bihar - Underdevelo
- Page 42 and 43:
4040
- Page 44 and 45:
Chapter IIAn enumeration of the dep
- Page 46 and 47:
Chapter IIBox 2.1 Macro Level Livel
- Page 48 and 49:
Chapter IIIn addition to the above,
- Page 50 and 51:
Chapter IIFig 2.1: Poverty Ratio am
- Page 52 and 53:
Chapter IIPoormigrantlabouroften su
- Page 54 and 55:
Chapter IIInterestingly, the Govern
- Page 56 and 57:
Chapter IIThe effective cost of nat
- Page 58 and 59:
Chapter IIsector and thereby casual
- Page 60 and 61:
Chapter IIReferences1. Aiyar , Swam
- Page 62 and 63:
Chapter IIIto, the vulnerability co
- Page 64 and 65:
Chapter IIIIt would be useful here
- Page 66 and 67:
Chapter IIIof new employment opport
- Page 68 and 69:
Chapter IIIinterest subvention - wo
- Page 70 and 71:
Chapter III6. The 11th Plan propose
- Page 72 and 73:
Chapter IIIBox 3.5: Rural Business
- Page 74 and 75:
Chapter III9. The achievement of ge
- Page 76 and 77:
Chapter IIIaid. The Plan also seeks
- Page 78 and 79:
Chapter IIIand health. They point o
- Page 80 and 81:
Chapter IIIReferences1. Ambasta, Pr
- Page 82 and 83:
8080
- Page 84 and 85:
Chapter IVtransport, storage, commu
- Page 86 and 87:
Chapter IVing of ‘English Speakin
- Page 88 and 89:
Chapter IVWhile these livelihoods h
- Page 90 and 91:
Chapter IVTable 4.6 Employment with
- Page 92 and 93:
Chapter IVConstruction requires no
- Page 94 and 95:
Chapter IVgains in manufacturing ha
- Page 96 and 97:
Chapter IV10. A Spatial Perspective
- Page 98 and 99:
Chapter IVA quick glance at some of
- Page 100 and 101:
Chapter IV12. Once a watershed is d
- Page 102:
Chapter IVThrougha range ofschemes
- Page 105 and 106:
Public Systems: Major central gover
- Page 107 and 108:
Public Systems: Major central gover
- Page 109 and 110:
Public Systems: Major central gover
- Page 111 and 112:
Public Systems: Major central gover
- Page 113 and 114:
Public Systems: Major central gover
- Page 115 and 116:
Public Systems: Major central gover
- Page 117 and 118:
Public Systems: Major central gover
- Page 119 and 120:
Public Systems: Major central gover
- Page 121 and 122:
Public Systems: Major central gover
- Page 123 and 124:
Public Systems: Major central gover
- Page 125 and 126:
Public Systems: Major central gover
- Page 127 and 128:
Public Systems: Major central gover
- Page 129 and 130:
Public Systems: Major central gover
- Page 131 and 132:
Public Systems: Major central gover
- Page 133 and 134:
Civil Society InitiativesChapter VI
- Page 135 and 136:
Civil Society InitiativesThe human
- Page 137 and 138:
Civil Society Initiativesso far has
- Page 139 and 140:
Civil Society Initiativesan 8 per c
- Page 141 and 142:
Civil Society InitiativesThe cooper
- Page 143 and 144:
Civil Society Initiativeslimited ir
- Page 145 and 146: Civil Society Initiativesintelligen
- Page 147 and 148: Civil Society InitiativesOutboard M
- Page 149 and 150: Civil Society InitiativesCase Study
- Page 151 and 152: Civil Society InitiativesReferences
- Page 153 and 154: The Contribution of Corporate Suppl
- Page 155 and 156: The Contribution of Corporate Suppl
- Page 157 and 158: The Contribution of Corporate Suppl
- Page 159 and 160: The Contribution of Corporate Suppl
- Page 161 and 162: The Contribution of Corporate Suppl
- Page 163 and 164: The Contribution of Corporate Suppl
- Page 165 and 166: The Contribution of Corporate Suppl
- Page 167 and 168: The Contribution of Corporate Suppl
- Page 169 and 170: The Contribution of Corporate Suppl
- Page 172 and 173: Chapter VIII170
- Page 174 and 175: Chapter VIIIcountry that make the e
- Page 176 and 177: Chapter VIIIFig 8.4: All-India area
- Page 178 and 179: Chapter VIIIWhen commercial crops l
- Page 180 and 181: Chapter VIIIunit of risk settlement
- Page 182 and 183: Chapter VIIIPublic capitalformation
- Page 184 and 185: Chapter VIII8. Integrated Rural Dev
- Page 186 and 187: Chapter VIIIAn expertpanel ‘sreco
- Page 188 and 189: Chapter VIIIHowever as final wage s
- Page 190: 188
- Page 193 and 194: appENDIX TableTable A.1.3: Distribu
- Page 195: appENDIX TableEmploymentEmploymentG
- Page 199 and 200: appENDIX TableTable 4: State Wise G
- Page 201 and 202: appENDIX TableTable-7: Distribution
- Page 203 and 204: appENDIX TableDams and Displacement
- Page 205 and 206: appENDIX TableFig. A.3.2: High Pote
- Page 207 and 208: appENDIX TableTable A.3.2Table 2: S
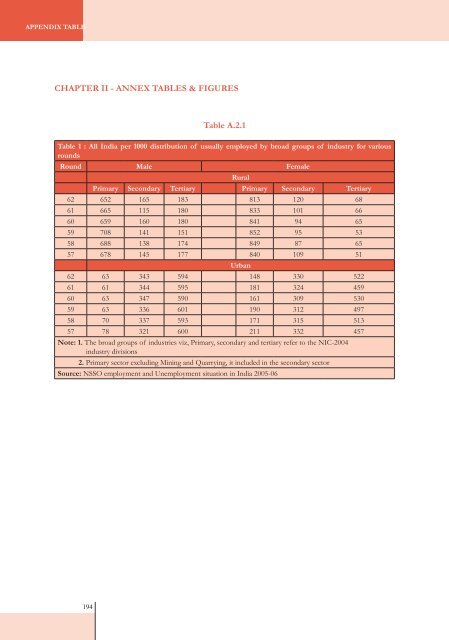
- Page 209 and 210: appENDIX TableChapter IV - ANNEX TA
- Page 211 and 212: appENDIX TableAnnex A.5.1Backward R
- Page 213 and 214: appENDIX TableAnnex A.5.3Some UNDP
- Page 215 and 216: appENDIX TableGross Value of Output
- Page 217 and 218: Mona DikshitMona Dikshit has been a