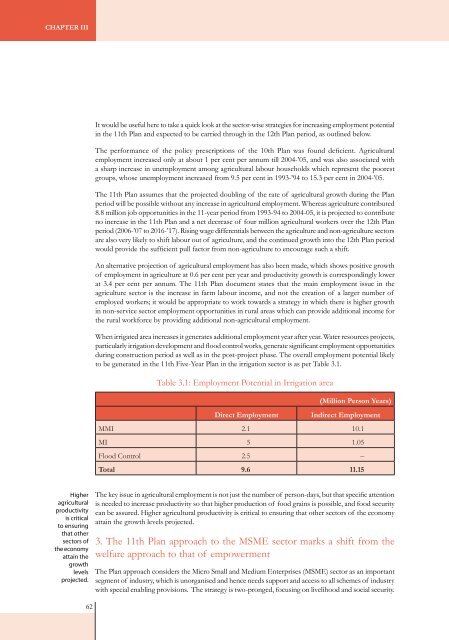
Chapter IIIIt would be useful here to take a quick look at the sector-wise strategies for increasing employment potentialin the 11th Plan and expected to be carried through in the 12th Plan period, as outlined below.The performance of the policy prescriptions of the 10th Plan was found deficient. Agriculturalemployment increased only at about 1 per cent per annum till 2004-’05, and was also associated witha sharp increase in unemployment among agricultural labour households which represent the poorestgroups, whose unemployment increased from 9.5 per cent in 1993-’94 to 15.3 per cent in 2004-’05.The 11th Plan assumes that the projected doubling of the rate of agricultural growth during the Planperiod will be possible without any increase in agricultural employment. Whereas agriculture contributed8.8 million job opportunities in the 11-year period from 1993-94 to 2004-05, it is projected to contributeno increase in the 11th Plan and a net decrease of four million agricultural workers over the 12th Planperiod (2006-’07 to 2016-’17). Rising wage differentials between the agriculture and non-agriculture sectorsare also very likely to shift labour out of agriculture, and the continued growth into the 12th Plan periodwould provide the sufficient pull factor from non-agriculture to encourage such a shift.An alternative projection of agricultural employment has also been made, which shows positive growthof employment in agriculture at 0.6 per cent per year and productivity growth is correspondingly lowerat 3.4 per cent per annum. The 11th Plan document states that the main employment issue in theagriculture sector is the increase in farm labour income, and not the creation of a larger number ofemployed workers; it would be appropriate to work towards a strategy in which there is higher growthin non-service sector employment opportunities in rural areas which can provide additional income forthe rural workforce by providing additional non-agricultural employment.When irrigated area increases it generates additional employment year after year. Water resources projects,particularly irrigation development and flood control works, generate significant employment opportunitiesduring construction period as well as in the post-project phase. The overall employment potential likelyto be generated in the 11th Five-Year Plan in the irrigation sector is as per Table 3.1.Table 3.1: Employment Potential in Irrigation areaDirect Employment(Million Person Years)Indirect EmploymentMMI 2.1 10.1MI 5 1.05Flood Control 2.5 –Total 9.6 11.1562Higheragriculturalproductivityis criticalto ensuringthat othersectors ofthe economyattain thegrowthlevelsprojected.The key issue in agricultural employment is not just the number of person-days, but that specific attentionis needed to increase productivity so that higher production of food grains is possible, and food securitycan be assured. Higher agricultural productivity is critical to ensuring that other sectors of the economyattain the growth levels projected.3. The 11th Plan approach to the MSME sector marks a shift from thewelfare approach to that of empowermentThe Plan approach considers the Micro Small and Medium Enterprises (MSME) sector as an importantsegment of industry, which is unorganised and hence needs support and access to all schemes of industrywith special enabling provisions. The strategy is two-pronged, focusing on livelihood and social security.62
Policy: Pathways to Sustainable LivelihoodsThe MSME sector in India has grown significantly since 1960, when there were only 12,376 MSMEsproviding employment to 10 lakh people, of which direct employment was 1.85 lakh; annual productionlevel was Rs 875 crore. At the beginning of the 10th Plan, 249 lakh people in the rural and urban areaswere employed in 105.21 lakh MSMEs. This has increased to 295 lakh people in 128 lakh units now; anaverage annual growth rate of 4.4 per cent in the number of these units and 4.62 per cent in employment.If the units in the khadi industries, village industries, and coir industries are taken into account, theemployment is estimated to be over 332 lakh persons in 2007-’08 (shown in Table 3.2).Table 3.2: Year-Wise Employment Potential in SMEs during 11th Plan2007-’08 <strong>2008</strong>-’09 2009-’10 2010-’11 2011-’12 CAGREmployment target(lakh persons) 322.28 338.39 355.31 373.08 391.73 4%The MSME sector is viewed by the Plan as primarily comprising weavers, artisans, and people engagedin food processing, hawkers, vendors, and carpenters. Inadequate working capital, lack of informationto access markets and foreign business opportunities, lack of trained personnel, and obsolete technologyare the major barriers to its growth. The 11th Plan prioritises the sector on the basis of its capacity toprovide livelihoods, check rural-urban migration, generate export earnings, and improve the lives of theremotest and most marginalised people. The needs, problems, and potential of this sector differ notjust with the nature of activity (weaving, building components for big industries, etc.), but also with size,geographical location, and structure (organised/unorganised). There is provision to provide social securitycover that is sensitive to women’s special needs along with easy access to credit to women entrepreneursand appropriate advisory and mentoring services.A cluster-based approach (discussed in Chapter IV) would be a major thrust of the 11th Plan in thecase of all the areas of MSMEs. This approach includes a number of enterprise-specific programmessuch as credit for modernisation, credit guarantee for tiny units without collateral, market developmentassistance and local infrastructure development through industry associations, and testing laboratoriesfor product quality. (Also see Box 3.2).The 11thPlanprioritisesthe sector onthe basis ofits capacityto providelivelihoods,checkrural-urbanmigration,generateexportearnings,and improvethe lives ofthe remotestand mostmarginalisedpeople.Box 3.2: Cluster <strong>Development</strong> ApproachClusters are defined as a sectoral and geographical concentration of enterprise, institutions, serviceproviders and related regulatory bodies, engaged in the production of homogeneous or inter-relatedproducts and faced with common opportunities and threats. In India there are about 6,600 clusterswhich are broadly categorised as i) high-tech clusters targeting innovation for existence ii) traditionalmanufacturing clusters (around 400) targeting competitiveness and consequent employment and iii)low-tech micro enterprise ‘poverty-intensive’ clusters (around 6,000) that have employment as wellas poverty implications.With the inclusion of handlooms, handicrafts, wool, and sericulture, the total number of jobs in theMSME sector in India goes up to 650 lakh. The employment intensity of the registered units indicatesthat an investment of Rs 0.72 lakh is required for creating one employment in the MSME sector asagainst Rs 5.56 lakh in the large organised sector.4. The 11th Plan aims at accelerating growth in employment in other sectors,countering past trendsThe sectors with prospects for high growth in output, creation of new establishments and for creation63
- Page 3 and 4:
State of India’s Livelihoods :The
- Page 5 and 6:
ChapterPage NoForeword 6Preface 8Ab
- Page 8:
ForewordAs a part of its microfinan
- Page 11 and 12:
employment growth, these sectors we
- Page 14: RIAARMKRRBRSVYSCSC/STsSCPSCSPSERPSE
- Page 20 and 21: Chapter Iresponse, risks and shocks
- Page 23 and 24: OverviewTable 1.2 Employment and Un
- Page 25 and 26: OverviewA recent paper by Arjun Sen
- Page 27: Overview4. How is the livelihood st
- Page 31 and 32: Overview5.2 Manmade constraints - i
- Page 33 and 34: Overviewthe late 1980s, these two m
- Page 35 and 36: OverviewIn the 1970s, the Chipko mo
- Page 37 and 38: Overviewsocial responsibility (CSR)
- Page 39 and 40: OverviewBox 1.3 Bihar - Underdevelo
- Page 42 and 43: 4040
- Page 44 and 45: Chapter IIAn enumeration of the dep
- Page 46 and 47: Chapter IIBox 2.1 Macro Level Livel
- Page 48 and 49: Chapter IIIn addition to the above,
- Page 50 and 51: Chapter IIFig 2.1: Poverty Ratio am
- Page 52 and 53: Chapter IIPoormigrantlabouroften su
- Page 54 and 55: Chapter IIInterestingly, the Govern
- Page 56 and 57: Chapter IIThe effective cost of nat
- Page 58 and 59: Chapter IIsector and thereby casual
- Page 60 and 61: Chapter IIReferences1. Aiyar , Swam
- Page 62 and 63: Chapter IIIto, the vulnerability co
- Page 66 and 67: Chapter IIIof new employment opport
- Page 68 and 69: Chapter IIIinterest subvention - wo
- Page 70 and 71: Chapter III6. The 11th Plan propose
- Page 72 and 73: Chapter IIIBox 3.5: Rural Business
- Page 74 and 75: Chapter III9. The achievement of ge
- Page 76 and 77: Chapter IIIaid. The Plan also seeks
- Page 78 and 79: Chapter IIIand health. They point o
- Page 80 and 81: Chapter IIIReferences1. Ambasta, Pr
- Page 82 and 83: 8080
- Page 84 and 85: Chapter IVtransport, storage, commu
- Page 86 and 87: Chapter IVing of ‘English Speakin
- Page 88 and 89: Chapter IVWhile these livelihoods h
- Page 90 and 91: Chapter IVTable 4.6 Employment with
- Page 92 and 93: Chapter IVConstruction requires no
- Page 94 and 95: Chapter IVgains in manufacturing ha
- Page 96 and 97: Chapter IV10. A Spatial Perspective
- Page 98 and 99: Chapter IVA quick glance at some of
- Page 100 and 101: Chapter IV12. Once a watershed is d
- Page 102: Chapter IVThrougha range ofschemes
- Page 105 and 106: Public Systems: Major central gover
- Page 107 and 108: Public Systems: Major central gover
- Page 109 and 110: Public Systems: Major central gover
- Page 111 and 112: Public Systems: Major central gover
- Page 113 and 114: Public Systems: Major central gover
- Page 115 and 116:
Public Systems: Major central gover
- Page 117 and 118:
Public Systems: Major central gover
- Page 119 and 120:
Public Systems: Major central gover
- Page 121 and 122:
Public Systems: Major central gover
- Page 123 and 124:
Public Systems: Major central gover
- Page 125 and 126:
Public Systems: Major central gover
- Page 127 and 128:
Public Systems: Major central gover
- Page 129 and 130:
Public Systems: Major central gover
- Page 131 and 132:
Public Systems: Major central gover
- Page 133 and 134:
Civil Society InitiativesChapter VI
- Page 135 and 136:
Civil Society InitiativesThe human
- Page 137 and 138:
Civil Society Initiativesso far has
- Page 139 and 140:
Civil Society Initiativesan 8 per c
- Page 141 and 142:
Civil Society InitiativesThe cooper
- Page 143 and 144:
Civil Society Initiativeslimited ir
- Page 145 and 146:
Civil Society Initiativesintelligen
- Page 147 and 148:
Civil Society InitiativesOutboard M
- Page 149 and 150:
Civil Society InitiativesCase Study
- Page 151 and 152:
Civil Society InitiativesReferences
- Page 153 and 154:
The Contribution of Corporate Suppl
- Page 155 and 156:
The Contribution of Corporate Suppl
- Page 157 and 158:
The Contribution of Corporate Suppl
- Page 159 and 160:
The Contribution of Corporate Suppl
- Page 161 and 162:
The Contribution of Corporate Suppl
- Page 163 and 164:
The Contribution of Corporate Suppl
- Page 165 and 166:
The Contribution of Corporate Suppl
- Page 167 and 168:
The Contribution of Corporate Suppl
- Page 169 and 170:
The Contribution of Corporate Suppl
- Page 172 and 173:
Chapter VIII170
- Page 174 and 175:
Chapter VIIIcountry that make the e
- Page 176 and 177:
Chapter VIIIFig 8.4: All-India area
- Page 178 and 179:
Chapter VIIIWhen commercial crops l
- Page 180 and 181:
Chapter VIIIunit of risk settlement
- Page 182 and 183:
Chapter VIIIPublic capitalformation
- Page 184 and 185:
Chapter VIII8. Integrated Rural Dev
- Page 186 and 187:
Chapter VIIIAn expertpanel ‘sreco
- Page 188 and 189:
Chapter VIIIHowever as final wage s
- Page 190:
188
- Page 193 and 194:
appENDIX TableTable A.1.3: Distribu
- Page 195 and 196:
appENDIX TableEmploymentEmploymentG
- Page 197 and 198:
appENDIX TableTable 2: Employment S
- Page 199 and 200:
appENDIX TableTable 4: State Wise G
- Page 201 and 202:
appENDIX TableTable-7: Distribution
- Page 203 and 204:
appENDIX TableDams and Displacement
- Page 205 and 206:
appENDIX TableFig. A.3.2: High Pote
- Page 207 and 208:
appENDIX TableTable A.3.2Table 2: S
- Page 209 and 210:
appENDIX TableChapter IV - ANNEX TA
- Page 211 and 212:
appENDIX TableAnnex A.5.1Backward R
- Page 213 and 214:
appENDIX TableAnnex A.5.3Some UNDP
- Page 215 and 216:
appENDIX TableGross Value of Output
- Page 217 and 218:
Mona DikshitMona Dikshit has been a