- Page 2 and 3:
MATHEMATICS INSCIENCE AND SOCIETYPl
- Page 4 and 5:
DIDACTICSTEACHING FOR TRANSFERthan
- Page 6 and 7:
DIDACTICSTEACHING FOR TRANSFEREmpha
- Page 8 and 9:
DIDACTICSTEACHING FOR TRANSFER1. Wh
- Page 10 and 11:
DIDACTICSTEACHING FOR TRANSFER14. I
- Page 12 and 13:
DIDACTICSTEACHING VIA PROBLEM SOLVI
- Page 14 and 15:
DIDACTICSTEACHING VIA PROBLEM SOLVI
- Page 16 and 17:
DIDACTICSTEACHING VIA PROBLEM SOLVI
- Page 18 and 19:
DIDACTICSTEACHING VIA PROBLEM SOLVI
- Page 20 and 21:
DIDACTICSTEACHING VIA PROBLEM SOLVI
- Page 22 and 23:
DIDACTICSTEACHING VIA PROBLEM SOLVI
- Page 24 and 25:
DIDACTICSTEACHING VIA PROBLEM SOLVI
- Page 26 and 27:
DIDACTICSTEACHING VIA PROBLEM SOLVI
- Page 28 and 29:
DIDACTICSTEACHING VIA PROBLEM SOLVI
- Page 30 and 31:
(((
- Page 32 and 33:
MATHEMATICS INSCIENCE AND SOCIETYPl
- Page 34 and 35:
DIDACTICSTEACHING VIA LAB APPROACHE
- Page 36 and 37:
DIDACTICSTEACHING VIA LAB APPROACHE
- Page 38 and 39:
DIDACTICSTEACHING VIA LAB APPROACHE
- Page 40 and 41:
DIDACTICSTEACHING VIA LAB APPROACHE
- Page 42 and 43:
DIDACTICSTEACHING VIA LAB APPROACHE
- Page 44 and 45:
DIDACTICSTEACHING VIA LAB APPROACHE
- Page 46 and 47:
DIDACTICSTEACHING VIA PROELEM SOLVI
- Page 48 and 49:
INTRODUCTIONMATHEMATICS AND ASTRONO
- Page 50 and 51:
(TITLEPAGETOPICMATHTYPEMaking Waves
- Page 52 and 53:
We all know that the Sun gives off
- Page 54 and 55:
TRACK RECORDS IN SPACE??? ---YOU WI
- Page 56 and 57:
MEA8UI2\NG BYTf2IAtJGULAlI0NHow can
- Page 58:
Angle measurements and scale drawin
- Page 61 and 62:
.. ~(CONT'>-lUe:O)3.In the city of
- Page 63 and 64:
\S THE SUMWITHIN RANGE?(PACOC 2.) D
- Page 65 and 66:
We can use a base line on the Earth
- Page 67 and 68:
, ,,,B. II,,,,, ,,, ,,EI\12T\-l1T
- Page 69 and 70:
2. The diagrams below represent two
- Page 71 and 72:
2. To construct a scale model of th
- Page 73 and 74:
In It's A Long Shot triangulation i
- Page 75 and 76:
(PAGE: 2.)f. Repeat steps b through
- Page 77 and 78:
A HVGE"CHUN\
- Page 79 and 80:
THATS A MODELI CAf\J I2ELATE TOe,AT
- Page 81 and 82:
One of two movies, Powers of Tenor
- Page 83 and 84:
~~t:P'The actual orbits of most ofh
- Page 85 and 86:
.KepIeY3Jaw( COt..lTlt-)UE,D )secon
- Page 87 and 88:
Exercises:1. An object is in an orb
- Page 89 and 90:
c. The average speed of Alpha is 8
- Page 91 and 92:
1) A Method for Drawing EllipsesCOM
- Page 93 and 94:
Our ancestors spent much time study
- Page 95 and 96:
The polar chart to the right can be
- Page 97 and 98:
C£OJSA2Yalternate interior angles.
- Page 99 and 100:
ASTRONOMYGLOSSARYmer-surmeridian (o
- Page 101 and 102:
NUM££ZCAL I1ATA1. Cons tants11 ""
- Page 103 and 104:
to MATHEMATICS AND BIOLOGYBiology--
- Page 105 and 106:
MATHEMATICS AND BIOLOGYTITLEPAGETOP
- Page 110 and 111:
1. Your body contains 206 bones.1Ab
- Page 112 and 113:
,1.1) Keep your fingers together an
- Page 114 and 115:
Tape a strip of butcher paper to th
- Page 116 and 117:
This activity will see how quickly
- Page 118 and 119:
.''Y07.(f2 IfEfiJ2r15.Jt. ELDOD;GOO
- Page 120 and 121:
~ ~My HEARTTHRO S~OR Yo~Materials N
- Page 122 and 123:
144III.IDEA FROM:(COWl"INU£O)Simpl
- Page 124 and 125:
I. Does a person's body temperature
- Page 126 and 127:
I. To measure your angle of periphe
- Page 128 and 129:
·"ltll•• oRLOSING(PAGE. 2)(.",
- Page 130 and 131: GAI.I•• oRLOSING ~(PAGE. 4)(Cal
- Page 132 and 133: GAI.I•• oeLOSINGc::rJ:f§3(PAG
- Page 134 and 135: V:hoi's YOUQ TYPE1. Weigh yourself
- Page 136 and 137: ~1AGN IFI EDARE DRAWN Te SCALE.spoR
- Page 138 and 139: A fly can sit on the surface of wat
- Page 140 and 141: ( ,An earthworm absorbs oxygen for
- Page 142 and 143: (CO~TIIJl>('O)(I4YBRID BROWt-.lBbB
- Page 144 and 145: ANAlYZ\NG1RA\T£(PAGE: 2.)I(o -t-II
- Page 146 and 147: a mode! 50r!nhQfitanc8/(, ,For this
- Page 148 and 149: WItAT TVPEARE YOII ?(CONTINUE:O)(\S
- Page 150 and 151: JUST LIKE PEASI~A~nD( COt-lTIt-JUED
- Page 152 and 153: BIOLOGY GLOSSARYlun-villung capacit
- Page 154 and 155: INTRODUCTIONENVIRONMENTThe pages in
- Page 156 and 157: (\What America is doing to reclaim
- Page 158 and 159: ((,(180
- Page 160 and 161: ~NVIQONMtNTSCOQtPut a check in the
- Page 162 and 163: [DMPUT~O~ DNDTW~~NVIODNM~NT(COIVTII
- Page 164 and 165: (TITLEPAGETOPICMATHTYPELet's Go Cou
- Page 166 and 167: (TITLE PAGE TOPIC MATH TYPEMATHEMAT
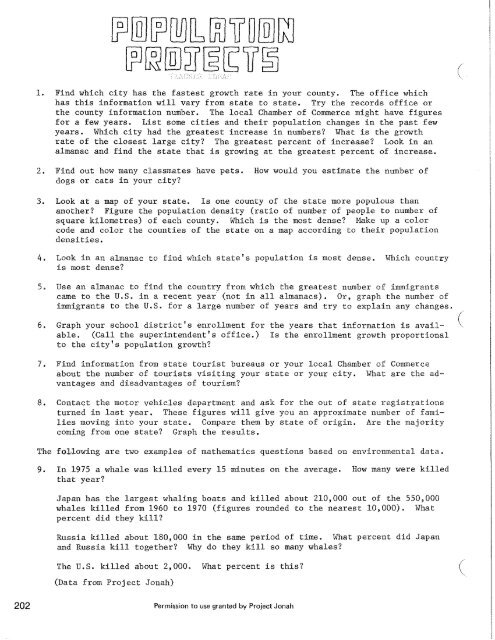
- Page 168 and 169: P~DPLb-[DUNTIN~ DQT~~'J1"-lE:'EEtU,
- Page 171 and 172: Percent ofPopulation total Land are
- Page 173 and 174: This table gives thepopulation of t
- Page 175 and 176: 0CE) ~:;<
- Page 177 and 178: Choose your own colors.o -1 million
- Page 179: IF PEOPLtW~Q~ LITTLtQDr. Igorovichs
- Page 183 and 184: "City Has A Million Rats""2,500,000
- Page 187 and 188: oSome chemicals do a good job of ki
- Page 189 and 190: PAIZTfCULA£POLLUTANTSTl-\(:Y USED
- Page 191 and 192: [RLLINCRLL [ARSToo many cars can ca
- Page 193 and 194: Do a lot of cars and bikes travel n
- Page 195 and 196: _28CITYCIRCUM5TRNCE5SGSPENDED PAR'l
- Page 197 and 198: ,/Needed:Watch, radio, metre stickC
- Page 199 and 200: 1. There has been a concern by envi
- Page 201 and 202: MY WATER USE (one day)1) On the ave
- Page 203 and 204: FI X TfiAT L(AK~ t t ~ ~Materials N
- Page 205 and 206: WATER POLLUTION, MAJOR DRAINAGE ARE
- Page 207: WRlERFigure VIII-14 - COMMERCIAL FI
- Page 210 and 211: Recent surveys continue to show tha
- Page 212 and 213: How much garbage, rubbish and junk
- Page 214 and 215: ~\JNNING~V7?(Unless more is found,t
- Page 216 and 217: · ~.; '. '" ~ : .... (Erosion is n
- Page 218 and 219: L~ND ~NDR~~OURC~£PROJbCTS1) What m
- Page 220 and 221: Needed:HOW MRNYHORStS IWatch with s
- Page 222 and 223: PULL FORPDOLINC~.~(Make plans to ta
- Page 224 and 225: (Both the car and the driver contri
- Page 226 and 227: ((This includes several ideas from
- Page 228 and 229: ENVIRONMENT GLOSSARYgra-watgram. A
- Page 230 and 231:
(Materials are available without oh
- Page 232 and 233:
SOURCESENVIRONMENTThe Population Co
- Page 234 and 235:
INTRODUCTION MATHEMATICS AND MUSICM
- Page 236 and 237:
Listen to the Students~ TO STUOCt\l
- Page 238 and 239:
(PAGE '2»(Ask students to look for
- Page 240 and 241:
(TITLEPAGETOPICMATHTYPEYou'd Better
- Page 242 and 243:
(----:--0-=---- APPEAREDWHOIN =----
- Page 244 and 245:
(Materials Needed:Record player wit
- Page 246 and 247:
PRE.5'2>URE: I~ GIVE./-.l l"l 'ORee
- Page 248 and 249:
Many musical terms have prefixes wh
- Page 250 and 251:
(Select aproject onthese or your ow
- Page 252 and 253:
INSTQUM~NTSWIT~ CLRSSClassification
- Page 254 and 255:
INST~UMtNTSWIT~CLRSS(PAGE 3) (After
- Page 256 and 257:
INSTRUMtNTSWIT~ [LRSS(PAGE: 5)(GUIT
- Page 258 and 259:
(A GAME IN RECOGNIZING ATTRIBUTES O
- Page 260 and 261:
(Materials:Playing board with 2 lar
- Page 262 and 263:
284NOTtS,~£STS'-tiD r~l1CrrONS(COI
- Page 264 and 265:
I~::::::::========-- ('(286
- Page 266 and 267:
lbTTbU[CJUf\JT fJI\j IT! (Counting
- Page 268 and 269:
Besides being fun to figure out, sy
- Page 270 and 271:
(Reflections do occur in music, bot
- Page 272 and 273:
Background for Student Page:(Studen
- Page 274 and 275:
(Background for Student Page:The no
- Page 276 and 277:
Background for Student Page:(Combin
- Page 278 and 279:
I. Water MusicMaterials:Activity:1.
- Page 280 and 281:
,.(Many people recognize a composer
- Page 282 and 283:
AdvertisementSolving Musical Myster
- Page 284 and 285:
(Material:RESTBlank music paperThre
- Page 286 and 287:
THETWtLVt- TONEM[T~OO(1.All twelve
- Page 288 and 289:
THETWtL Vt- TDNtM[T/-{OO(PAGE 3)(VI
- Page 290 and 291:
( .V. Most people can tell a differ
- Page 292 and 293:
-~r:Jb Wb ON TWb, !:~Mb ~Ql:OUbN[l,
- Page 294 and 295:
~U&1nI[I§F~15g~~g5(PAGE 2)The huma
- Page 296 and 297:
318Loud musicmay cause• •migraI
- Page 298 and 299:
(Select some of the following proje
- Page 300 and 301:
(1) How does sound travel? Howfast
- Page 302 and 303:
MUSIC GLOSSARYfif-notfifth.firstsca
- Page 304 and 305:
MUSIC GLOSSARYtern-wootempo. The ra
- Page 306 and 307:
INTRODUCTIONMATHEMATICS AND PHYSICS
- Page 308 and 309:
TITLEPAGE'fOPICMATHTYPEArchimedes K
- Page 310 and 311:
Above every person is a tall column
- Page 312 and 313:
Materials Needed:ISet up a pendulum
- Page 314 and 315:
(Materials Needed:2 metre sticks, s
- Page 316 and 317:
IVGraphing the results.(COl\llIlJUE
- Page 318 and 319:
Have a student bring a 5 or 10 spee
- Page 320 and 321:
(Materials Needed:An inclined plane
- Page 322 and 323:
BEING \tJTHE: MCDOL.E:Of: THINGS (I
- Page 324 and 325:
Materials Needed:REW.ii~W~EXPEj;2IE
- Page 326 and 327:
The following activities investigat
- Page 328 and 329:
~~lt~~ ~NDHALF-LIFE/,Materials Need
- Page 330 and 331:
QJ~t~Ur! RNDHALF-LIFE (Nuclear reac
- Page 332 and 333:
Albert A. Michelson (1852 - 1931),
- Page 334 and 335:
RtFLECTIONS2~OITJ3J13R(Two figures
- Page 336 and 337:
MIRROR, MIPPOQON TI-I[; WHLL(Materi
- Page 338 and 339:
IV~~~~~~( CONl"lNUED)Making some me
- Page 340 and 341:
(Materials Needed:Magnifying mirror
- Page 342 and 343:
(To project an image using a concav
- Page 344 and 345:
Step DBENDING OF LIGHT?

