Analysis of the Operation and Financial Condition of the Enterprise
Analysis of the Operation and Financial Condition of the Enterprise
Analysis of the Operation and Financial Condition of the Enterprise

Create successful ePaper yourself
Turn your PDF publications into a flip-book with our unique Google optimized e-Paper software.
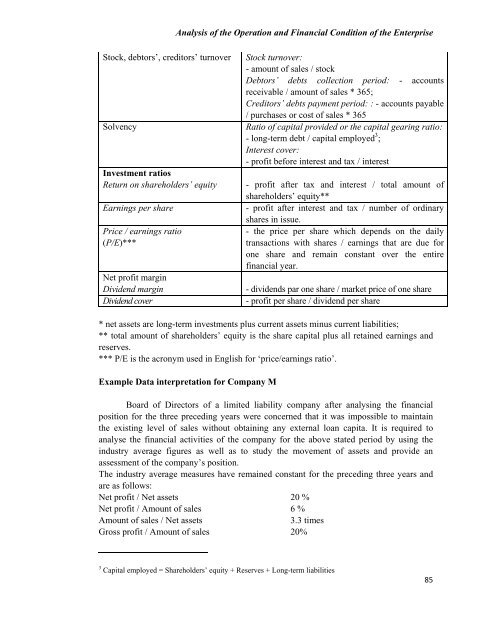
<strong>Analysis</strong> <strong>of</strong> <strong>the</strong> <strong>Operation</strong> <strong>and</strong> <strong>Financial</strong> <strong>Condition</strong> <strong>of</strong> <strong>the</strong> <strong>Enterprise</strong>Stock, debtors’, creditors’ turnoverSolvencyInvestment ratiosReturn on shareholders’ equityEarnings per sharePrice / earnings ratio(P/E)***Net pr<strong>of</strong>it marginDividend marginDividend coverStock turnover:- amount <strong>of</strong> sales / stockDebtors’ debts collection period: - accountsreceivable / amount <strong>of</strong> sales * 365;Creditors’ debts payment period: : - accounts payable/ purchases or cost <strong>of</strong> sales * 365Ratio <strong>of</strong> capital provided or <strong>the</strong> capital gearing ratio:- long-term debt / capital employed 3 ;Interest cover:- pr<strong>of</strong>it before interest <strong>and</strong> tax / interest- pr<strong>of</strong>it after tax <strong>and</strong> interest / total amount <strong>of</strong>shareholders’ equity**- pr<strong>of</strong>it after interest <strong>and</strong> tax / number <strong>of</strong> ordinaryshares in issue.- <strong>the</strong> price per share which depends on <strong>the</strong> dailytransactions with shares / earnings that are due forone share <strong>and</strong> remain constant over <strong>the</strong> entirefinancial year.- dividends par one share / market price <strong>of</strong> one share- pr<strong>of</strong>it per share / dividend per share* net assets are long-term investments plus current assets minus current liabilities;** total amount <strong>of</strong> shareholders’ equity is <strong>the</strong> share capital plus all retained earnings <strong>and</strong>reserves.*** P/E is <strong>the</strong> acronym used in English for ‘price/earnings ratio’.Example Data interpretation for Company MBoard <strong>of</strong> Directors <strong>of</strong> a limited liability company after analysing <strong>the</strong> financialposition for <strong>the</strong> three preceding years were concerned that it was impossible to maintain<strong>the</strong> existing level <strong>of</strong> sales without obtaining any external loan capita. It is required toanalyse <strong>the</strong> financial activities <strong>of</strong> <strong>the</strong> company for <strong>the</strong> above stated period by using <strong>the</strong>industry average figures as well as to study <strong>the</strong> movement <strong>of</strong> assets <strong>and</strong> provide anassessment <strong>of</strong> <strong>the</strong> company’s position.The industry average measures have remained constant for <strong>the</strong> preceding three years <strong>and</strong>are as follows:Net pr<strong>of</strong>it / Net assets 20 %Net pr<strong>of</strong>it / Amount <strong>of</strong> sales 6 %Amount <strong>of</strong> sales / Net assets3.3 timesGross pr<strong>of</strong>it / Amount <strong>of</strong> sales 20%3 Capital employed = Shareholders’ equity + Reserves + Long-term liabilities85