EQAS Program User Guide - QCNet
EQAS Program User Guide - QCNet
EQAS Program User Guide - QCNet

Create successful ePaper yourself
Turn your PDF publications into a flip-book with our unique Google optimized e-Paper software.
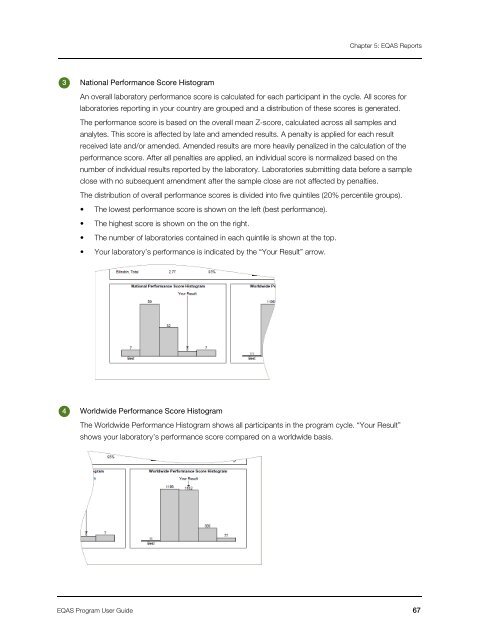
Chapter 5: <strong>EQAS</strong> Reports3National Performance Score HistogramAn overall laboratory performance score is calculated for each participant in the cycle. All scores forlaboratories reporting in your country are grouped and a distribution of these scores is generated.The performance score is based on the overall mean Z-score, calculated across all samples andanalytes. This score is affected by late and amended results. A penalty is applied for each resultreceived late and/or amended. Amended results are more heavily penalized in the calculation of theperformance score. After all penalties are applied, an individual score is normalized based on thenumber of individual results reported by the laboratory. Laboratories submitting data before a sampleclose with no subsequent amendment after the sample close are not affected by penalties.The distribution of overall performance scores is divided into five quintiles (20% percentile groups).• The lowest performance score is shown on the left (best performance).• The highest score is shown on the on the right.• The number of laboratories contained in each quintile is shown at the top.• Your laboratory’s performance is indicated by the “Your Result” arrow.4Worldwide Performance Score HistogramThe Worldwide Performance Histogram shows all participants in the program cycle. “Your Result”shows your laboratory’s performance score compared on a worldwide basis.<strong>EQAS</strong> <strong>Program</strong> <strong>User</strong> <strong>Guide</strong> 67