EQAS Program User Guide - QCNet
EQAS Program User Guide - QCNet
EQAS Program User Guide - QCNet

Create successful ePaper yourself
Turn your PDF publications into a flip-book with our unique Google optimized e-Paper software.
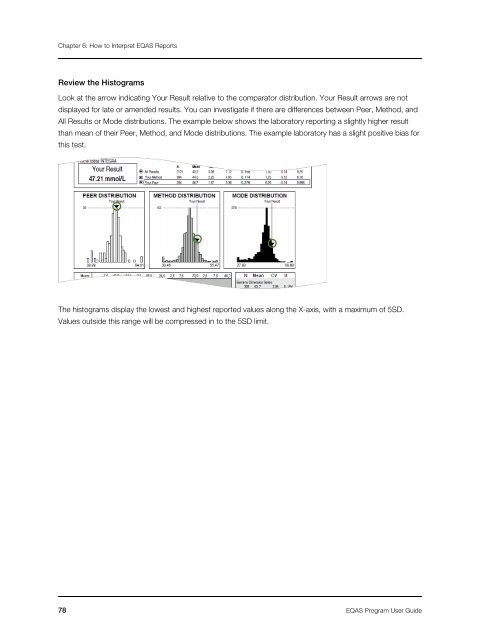
Chapter 6: How to Interpret <strong>EQAS</strong> ReportsReview the HistogramsLook at the arrow indicating Your Result relative to the comparator distribution. Your Result arrows are notdisplayed for late or amended results. You can investigate if there are differences between Peer, Method, andAll Results or Mode distributions. The example below shows the laboratory reporting a slightly higher resultthan mean of their Peer, Method, and Mode distributions. The example laboratory has a slight positive bias forthis test.The histograms display the lowest and highest reported values along the X-axis, with a maximum of 5SD.Values outside this range will be compressed in to the 5SD limit.78 <strong>EQAS</strong> <strong>Program</strong> <strong>User</strong> <strong>Guide</strong>