EQAS Program User Guide - QCNet
EQAS Program User Guide - QCNet
EQAS Program User Guide - QCNet
Create successful ePaper yourself
Turn your PDF publications into a flip-book with our unique Google optimized e-Paper software.
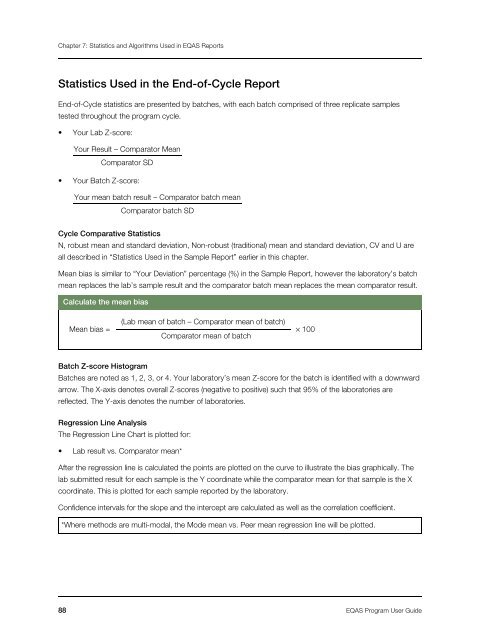
Chapter 7: Statistics and Algorithms Used in <strong>EQAS</strong> ReportsStatistics Used in the End-of-Cycle ReportEnd-of-Cycle statistics are presented by batches, with each batch comprised of three replicate samplestested throughout the program cycle.• Your Lab Z-score:Your Result – Comparator MeanComparator SD• Your Batch Z-score:Your mean batch result – Comparator batch meanComparator batch SDCycle Comparative StatisticsN, robust mean and standard deviation, Non-robust (traditional) mean and standard deviation, CV and U areall described in “Statistics Used in the Sample Report” earlier in this chapter.Mean bias is similar to “Your Deviation” percentage (%) in the Sample Report, however the laboratory’s batchmean replaces the lab’s sample result and the comparator batch mean replaces the mean comparator result.Calculate the mean biasMean bias =(Lab mean of batch – Comparator mean of batch)Comparator mean of batch 100Batch Z-score HistogramBatches are noted as 1, 2, 3, or 4. Your laboratory’s mean Z-score for the batch is identified with a downwardarrow. The X-axis denotes overall Z-scores (negative to positive) such that 95% of the laboratories arereflected. The Y-axis denotes the number of laboratories.Regression Line AnalysisThe Regression Line Chart is plotted for:• Lab result vs. Comparator mean*After the regression line is calculated the points are plotted on the curve to illustrate the bias graphically. Thelab submitted result for each sample is the Y coordinate while the comparator mean for that sample is the Xcoordinate. This is plotted for each sample reported by the laboratory.Confidence intervals for the slope and the intercept are calculated as well as the correlation coefficient.*Where methods are multi-modal, the Mode mean vs. Peer mean regression line will be plotted.88 <strong>EQAS</strong> <strong>Program</strong> <strong>User</strong> <strong>Guide</strong>


