Annex 2.5MAINLAND AREA, TOTAL POPULATION AND POPULATION DENSITYBY PROVINCE <strong>2010</strong>NoProvincesMainlandArea(Km²) (a)Per Km²(1) (2) (3) (4) (5) (6) (7)1 Aceh 57,956 2,248,952 2,245,458 4,494,410 782 North Sumatera 72,981 6,483,354 6,498,850 12,982,204 1783 West Sumatera 42,013 2,404,377 2,442,532 4,846,909 1154 Riau 87,024 2,853,168 2,685,199 5,538,367 645 Jambi 50,058 1,581,110 1,511,155 3,092,265 626 South Sumatera 91,592 3,792,647 3,657,747 7,450,394 817 Bengkulu 19,919 877,159 838,359 1,715,518 868 Lampung 34,624 3,916,622 3,691,783 7,608,405 2209 Bangka Belitung Islands 16,424 635,094 588,202 1,223,296 7410 Riau Islands 8,202 862,144 817,019 1,679,163 20511 DKI Jakarta 664 4,870,938 4,736,849 9,607,787 14,46912 West Java 35,378 21,907,040 21,146,692 43,053,732 1,21713 Central Java 32,801 16,091,112 16,291,545 32,382,657 98714 DI Yogyakarta 3,133 1,708,910 1,748,581 3,457,491 1,10415 East Java 47,800 18,503,516 18,973,241 37,476,757 78416 Banten 9,663 5,439,148 5,193,018 10,632,166 1,10017 Bali 5,780 1,961,348 1,929,409 3,890,757 67318 West Nusa Tenggara 18,572 2,183,646 2,316,566 4,500,212 24219 East Nusa Tenggara 48,718 2,326,487 2,357,340 4,683,827 9620 West Kalimantan 147,307 2,246,903 2,149,080 4,395,983 3021 Central Kalimantan 153,565 1,153,743 1,058,346 2,212,089 1422 South Kalimantan 38,744 1,836,210 1,790,406 3,626,616 9423 East Kalimantan 204,534 1,871,690 1,681,453 3,553,143 1724 North Sulawesi 13,852 1,159,903 1,110,693 2,270,596 16425 Central Sulawesi 61,841 1,350,844 1,284,165 2,635,009 4326 South Sulawesi 46,717 3,924,431 4,110,345 8,034,776 17227 Southeast Sulawesi 38,068 1,121,826 1,110,760 2,232,586 5928 Gorontalo 11,257 521,914 518,250 1,040,164 9229 West Sulawesi 16,787 581,526 577,125 1,158,651 6930 Maluku 46,914 775,477 758,029 1,533,506 3331 North Maluku 31,983 531,393 506,694 1,038,087 3232 West Papua 97,024 402,398 358,024 760,422 833 Papua 319,036 1,505,883 1,327,498 2,833,381 9<strong>Indonesia</strong>1,910,931.32 119,630,913 118,010,413 237,641,326 124Source: (a) Directorate General PUM of Ministry of Home Affairs, <strong>2010</strong>(b) BPS-Statistics <strong>Indonesia</strong>, Population Census <strong>2010</strong>Total Population (people) [b]Males Females Males + FemalesPopulationDensity
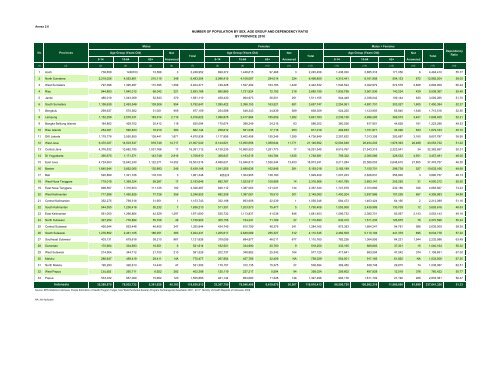
Annex 2.6NUMBER OF POPULATION BY SEX, AGE GROUP AND DEPENDENCY RATIOBY PROVINCE <strong>2010</strong>NoProvincesMalesFemalesMales + FemalesAge Group (Years Old)Not Age Group (Years Old)Not Age Group (Years Old)NotTotalTotal0-14 15-64 65+ Answered 0-14 15-64 65+ Answered 0-14 15-64 65+ AnsweredTotalDependencyRatio(1) (2) (3) (4) (5) (6) (7) (8) (9) (10) (11) (12) (13) (14) (15) (16) (17) (18)1 Aceh 738,658 1436703 73,588 3 2,248,952 699,372 1,448,615 97,468 3 2,245,458 1,438,030 2,885,318 171,056 6 4,494,410 55.772 North Sumatera 2,219,026 4,053,861 210,119 348 6,483,354 2,096,415 4,108,097 294,014 324 6,498,850 4,315,441 8,161,958 504,133 672 12,982,204 59.053 West Sumatera 797,096 1,495,487 110,395 1,399 2,404,377 749,428 1,527,492 164,183 1,429 2,442,532 1,546,524 3,022,979 274,578 2,828 4,846,909 60.244 Riau 944,893 1,840,012 68,042 221 2,853,168 890,865 1,721,924 72,192 218 2,685,199 1,835,758 3,561,936 140,234 439 5,538,367 55.485 Jambi 485,019 1,043,069 52,643 379 1,581,110 459,430 994,973 56,501 251 1,511,155 944,449 2,038,042 109,144 630 3,092,265 51.706 South Sumatera 1,158,639 2,493,548 139,506 954 3,792,647 1,095,422 2,398,153 163,521 651 3,657,747 2,254,061 4,891,701 303,027 1,605 7,450,394 52.277 Bengkulu 269,637 575,562 31,001 959 877,159 254,588 548,343 34,839 589 838,359 524,225 1,123,905 65,840 1,548 1,715,518 52.508 Lampung 1,152,258 2,578,331 183,914 2,119 3,916,622 1,086,878 2,417,964 185,659 1,282 3,691,783 2,239,136 4,996,295 369,573 3,401 7,608,405 52.219 Bangka Belitung Islands 184,862 429,702 20,412 118 635,094 175,674 388,249 24,216 63 588,202 360,536 817,951 44,628 181 1,223,296 49.5310 Riau Islands 254,021 590,833 16,910 380 862,144 238,612 561,038 17,116 253 817,019 492,633 1,151,871 34,026 633 1,679,163 45.7211 DKI Jakarta 1,179,776 3,550,850 138,441 1,871 4,870,938 1,117,856 3,462,458 155,246 1,289 4,736,849 2,297,632 7,013,308 293,687 3,160 9,607,787 36.9512 West Java 6,470,027 14,503,547 918,749 14,717 21,907,040 6,124,621 13,950,656 1,059,644 11,771 21,146,692 12,594,648 28,454,203 1,978,393 26,488 43,053,732 51.2213 Central Java 4,376,532 10,682,795 1,031,768 17 16,091,112 4,139,235 10,860,520 1,291,773 17 16,291,545 8,515,767 21,543,315 2,323,541 34 32,382,657 50.3114 DI Yogyakarta 390,675 1,171,571 143,748 2,916 1,708,910 368,647 1,193,515 184,784 1,635 1,748,581 759,322 2,365,086 328,532 4,551 3,457,491 46.0015 East Java 4,724,653 12,642,240 1,122,271 14,352 18,503,516 4,486,631 12,946,813 1,526,344 13,453 18,973,241 9,211,284 25,589,053 2,648,615 27,805 37,476,757 46.3516 Banten 1,640,944 3,662,065 135,893 246 5,439,148 1,541,255 3,488,636 162,846 281 5,193,018 3,182,199 7,150,701 298,739 527 10,632,166 48.6817 Bali 520,899 1,321,726 118,720 3 1,961,348 486324 1,304,905 138,180 1,929,409 1,007,223 2,626,631 256,900 3 3,890,757 48.1318 West Nusa Tenggara 719,018 1,369,324 95,287 17 2,183,646 682,767 1,523,817 109,968 14 2,316,566 1,401,785 2,893,141 205,255 31 4,500,212 55.5519 East Nusa Tenggara 898,567 1,316,603 111,125 192 2,326,487 849,112 1,387,063 121,031 134 2,357,340 1,747,679 2,703,666 232,156 326 4,683,827 73.2320 West Kalimantan 717,996 1,450,825 77,726 356 2,246,903 682,208 1,387,061 79,510 301 2,149,080 1,400,204 2,837,886 157,236 657 4,395,983 54.8821 Central Kalimantan 352,275 769,516 31,951 1 1,153,743 332,198 693,908 32,239 1 1,058,346 684,473 1,463,424 64,190 2 2,212,089 51.1622 South Kalimantan 544,555 1,236,416 55,232 7 1,836,210 511,351 1,203,573 75,477 5 1,790,406 1,055,906 2,439,989 130,709 12 3,626,616 48.6323 East Kalimantan 561,000 1,266,864 42,529 1,297 1,871,690 525,732 1,113,837 41,038 846 1,681,453 1,086,732 2,380,701 83,567 2,143 3,553,143 49.1624 North Sulawesi 327,254 776,894 55,706 49 1,159,903 305,156 734,341 71,169 27 1,110,693 632,410 1,511,235 126,875 76 2,270,596 50.2425 Central Sulawesi 450,644 853,448 46,405 347 1,350,844 424,749 810,799 48,376 241 1,284,165 875,393 1,664,247 94,781 588 2,635,009 58.3026 South Sulawesi 1,276,892 2,461,105 186,051 383 3,924,431 1,205,617 2,649,089 255,327 312 4,110,345 2,482,509 5,110,194 441,378 695 8,034,776 57.2227 Southeast Sulawesi 403,131 679,618 38,210 867 1,121,826 379,095 684,977 46,011 677 1,110,760 782,226 1,364,595 84,221 1,544 2,232,586 63.4928 Gorontalo 170,664 334,693 16,551 6 521,914 162,501 334,990 20,750 9 518,250 333,165 669,683 37,301 15 1,040,164 55.3229 West Sulawesi 214,904 344,712 21,700 210 581,526 202,737 348,882 25,342 164 577,125 417,641 693,594 47,042 374 1,158,651 67.0030 Maluku 286,647 459,419 29,411 NA 775,477 267,854 457,766 32,409 NA 758,029 554,501 917,185 61,820 NA 1,533,506 67.2031 North Maluku 190,293 326,613 14,440 47 531,393 179,157 312,135 15,375 27 506,694 369,450 638,748 29,815 74 1,038,087 62.5132 West Papua 134,483 260,711 6,922 282 402,398 125,119 227,217 5,594 94 358,024 259,602 487,928 12,516 376 760,422 55.7733 Papua 533,032 957,069 15,662 120 1,505,883 461,144 854,680 11,528 146 1,327,498 994,176 1,811,749 27,190 266 2,833,381 56.37<strong>Indonesia</strong>35,288,970 78,935,732 5,361,028 45,183 119,630,913 33,307,750 78,046,486 6,619,670 36,507 118,010,413 68,596,720 156,982,218 11,980,698 81,690 237,641,326 51.33Source: BPS-Statistics <strong>Indonesia</strong>, People Estimation of <strong>Health</strong> Program Target, from"Data Penduduk Sasaran Program Pembangunan Kesehatan 2007 - 2011", Ministry of <strong>Health</strong> Republic of <strong>Indonesia</strong>, 2009.NA: Not Aplicable
- Page 2 and 3:
351.770212IndIINDONESIA HEALTH PROF
- Page 4 and 5:
EDITOR OF BOARDAdvisordr. Ratna Ros
- Page 6 and 7:
This Indonesia Health Profile is pr
- Page 8 and 9:
FOREWORDACKNOWLEDGEMENT OF GENERAL
- Page 10 and 11:
Annex 2.1 Distribution of Governmen
- Page 12 and 13:
Annex 3.17 TB Period Prevalence (D)
- Page 14 and 15:
Annex 4.23 Percentage of Population
- Page 16 and 17:
Annex 5.21 Recapitulation of Gradua
- Page 19 and 20:
Ministry of Health's vision is "Hea
- Page 21:
population, birth rate, mortality r
- Page 24 and 25:
Population growth is the change in
- Page 26 and 27:
Age structure of population by sex
- Page 28 and 29:
km2. Provinces with the highest lev
- Page 30 and 31:
GRAPH 2.7DEPENDENCY RATIO BY PROVIN
- Page 32 and 33:
GRAPH 2.8PERCENTAGE OF UNEMPLOYMENT
- Page 34 and 35:
TABLE 2.3NUMBER OF UNDERDEVELOPED D
- Page 36 and 37:
Based on data of number of poor peo
- Page 38 and 39:
GRAPH 2.12PERCENTAGE OF HOUSEHOLD B
- Page 40 and 41:
GRAPH 2.14PERCENTAGE OF HOUSEHOLD B
- Page 42 and 43:
GRAPH 2.16PERCENTAGE OF PEOPLE AGE
- Page 44 and 45:
GRAPH 2.18PERCENTAGE OF WOMEN AGE 1
- Page 47 and 48:
There are several indicators used o
- Page 49 and 50:
2. Underfive Mortality Rate (UMR)Un
- Page 51 and 52:
4. Crude Death RateCrude Death Rate
- Page 53 and 54:
No1234TABEL 3.110 MAIN DISEASES ON
- Page 55 and 56:
Chronic nutrition problem indicated
- Page 57 and 58:
Educationlevel ofparentsTABLE 3.5PR
- Page 59 and 60:
DG of Diasease Control and Environm
- Page 61 and 62:
GRAPH 3.10CASE DETECTION RATE (CDR)
- Page 63 and 64:
c. HIV/AIDSHIV/AIDS is one of commu
- Page 65 and 66:
GRAPH 3.15PERCENTAGE OF AIDS CUMULA
- Page 67 and 68:
GRAPH 3.18NUMBER OF PAUCI BACILLARY
- Page 69 and 70:
GRAPH 3.21PREVALENCE OF YAWS IN IND
- Page 71 and 72:
GRAPH 3.23NUMBER OF DIPTHERIA CASES
- Page 73 and 74:
GRAPH 3.25INCIDENCE RATE OF DHF PER
- Page 75 and 76:
GRAPH 3.29CASE FATALITY RATE (CFR)
- Page 77 and 78:
Above graph shows rising trend of G
- Page 79 and 80:
g. LeptospirosisLeptospirosis is tr
- Page 81:
There were three provinces with hig
- Page 84 and 85:
Survey (SDKI) 2007 recorded MMR 228
- Page 86 and 87:
Graph 4.2 presents achievement of K
- Page 88 and 89:
. Delivery Attendance by Midwifery
- Page 90 and 91:
access of delivery mother to health
- Page 92 and 93:
GRAPH 4.9COVERAGE OF POSTPARTUM CAR
- Page 94 and 95:
Polindes (village maternal clinic),
- Page 96 and 97:
GRAPH 4.14COVERAGE OF COMPLETE NEON
- Page 98 and 99:
g. Underfive Health CareUnderfive h
- Page 100 and 101:
GRAPH 4.19COVERAGE OF PRIMARY SCHOO
- Page 102 and 103:
By sex, method of contraceptive use
- Page 104 and 105:
Of 33 provinces in Indonesia, 20 pr
- Page 106 and 107:
Drop out rate of DPT‐Hb1‐measle
- Page 108 and 109:
Annex 4.43 and Annex 4.44 show drug
- Page 110 and 111:
Other indicator of hospital service
- Page 112 and 113:
In 2010, there were 36.23 million v
- Page 114 and 115:
temperature must be between 0‐8º
- Page 116 and 117:
has increased significantly from 20
- Page 118 and 119:
106Average coverage of pneumonia ca
- Page 120 and 121:
Batam and Mataram. In 2010, it was
- Page 122 and 123:
110Second‐level physical defect c
- Page 124 and 125:
districts/municipalities (25%) of f
- Page 126 and 127:
Monitoring of malaria vector suscep
- Page 128 and 129:
1. Iron (Fe) Tablet Supplementation
- Page 130 and 131:
GRAPH 4.51PERCENTAGE OF WOMEN SWALL
- Page 132 and 133:
GRAPH 4.53PERCENTAGE OF UNDERFIVE G
- Page 134 and 135:
122were West Nusa Tenggara, Bengkul
- Page 136 and 137:
encouraging mother to breastfeed ba
- Page 138:
people by type of disaster and vict
- Page 141 and 142:
GRAPH 5.1RATIO OF HEALTH CENTER PER
- Page 143 and 144:
Table 5.1 below shows the developme
- Page 145 and 146: GRAPH 5.6NUMBER OF SPECIALTY HOSPIT
- Page 147 and 148: Proportion of beds in general hospi
- Page 149 and 150: While distribution facilities of ph
- Page 151 and 152: GRAPH 5.14RATIO OF POSKESDES TO VIL
- Page 153 and 154: Graph 5.17 shows number of majors/s
- Page 155 and 156: Number of Diknakes institutions of
- Page 157 and 158: Health human resources data had alr
- Page 159 and 160: In 2010 there were 120 specialist d
- Page 161 and 162: physicians and 112 dentists. Graph
- Page 163 and 164: anging from 6 to 14 lecturers. Whil
- Page 165: Participants of National Community
- Page 168 and 169: GRAPH 6.1POPULATION IN ASEAN & SEAR
- Page 170 and 171: In SEARO region, Timor Leste had th
- Page 172 and 173: By those key indicators, in 2010, t
- Page 174 and 175: GRAPH 6.8GROSS NATIONAL INCOME (GNI
- Page 176 and 177: Data in “World Health Statistics
- Page 178 and 179: Indonesia was on the 2 nd lowest po
- Page 180 and 181: Avian Influenza firstly entered ASE
- Page 182 and 183: Indonesia, which in 2005 got the ou
- Page 184 and 185: GRAPH 6.17COVERAGE OF VACCINATIONIN
- Page 186 and 187: 3. Improved DrinkingWater Source
- Page 188 and 189: BPS Statistics Indonesia. 2006. Est
- Page 190: ___________. 2005. Publikasi Hasil
- Page 193 and 194: Annex 2.2TOTAL POPULATION BY SEX AN
- Page 195: Annex 2.4POPULATION GROWTH RATEBY P
- Page 199 and 200: Annex 2.838 DISTRICTS AS PRIORITY A
- Page 201 and 202: Annex 2.10NUMBER AND PERCENTAGE OF
- Page 203 and 204: Annex 2.12PERCENTAGE OF HOUSEHOLDS
- Page 205 and 206: Annex 2.14PERCENTAGE OF HOUSEHOLDS
- Page 207 and 208: Annex 2.16PERCENTAGE OF HOUSEHOLDS
- Page 209 and 210: Annex 2.18PERCENTAGE OF HOUSEHOLDS
- Page 211 and 212: Annex 2.20PERCENTAGE OF HOUSEHOLDS
- Page 213 and 214: Annex 2.22PERCENTAGE OF HOUSEHOLDS
- Page 215 and 216: Annex 2.24PREVALENCE OF SMOKERS 15
- Page 217 and 218: Annex 2.26PERCENTAGE OF WOMEN AGED
- Page 219 and 220: Annex 3.1ESTIMATION OF INFANT MORTA
- Page 221 and 222: Annex 3.310 MAIN DISEASES OF HOSPIT
- Page 223 and 224: Annex 3.5PREVALENCE OF UNDERFIVE NU
- Page 225 and 226: Annex 3.7PREVALENCE OF UNDERFIVE NU
- Page 227 and 228: Annex 3.9PREVALENCE OF ADULT NUTRIT
- Page 229 and 230: Annex 3.11ANNUAL PARASITE INSIDENCE
- Page 231 and 232: Annex 3.13Detection CoverageNo Prov
- Page 233 and 234: Annex 3.15NoProvinces(1) (2) (3) (4
- Page 235 and 236: Annex 3.17TB PERIOD PREVALENCE (D)
- Page 237 and 238: Annex 3.19NoProvincesAIDS CUMULATIV
- Page 239 and 240: Annex 3.21NUMBER OF UNDERFIVE PNEUM
- Page 241 and 242: Annex 3.23NUMBER OF TETANUS NEONATO
- Page 243 and 244: Annex 3.25NUMBER OF MEASLES CASESBY
- Page 245 and 246: Annex 3.27OUTBREAK FREQUENCY AND NU
- Page 247 and 248:
Annex 3.29NUMBER OF DIPHTERIA CASES
- Page 249 and 250:
Annex 3.31NUMBER OF AFP CASES AND N
- Page 251 and 252:
Annex 3.33NUMBER OF DISTRICTS/MUNIC
- Page 253 and 254:
Annex 3.35NUMBER OF CHIKUNGUNYA CAS
- Page 255 and 256:
Annex 3.37NUMBER OF FILARIASIS CASE
- Page 257 and 258:
Annex 3.39NUMBER OF LEPTOSPYROSIS C
- Page 259 and 260:
Annex 3.41NUMBER OF AVIAN INFLUENZA
- Page 261 and 262:
Annex 4.2PERCENTAGE OF WOMEN AGE 10
- Page 263 and 264:
Annex 4.4PERCENTAGE OF WOMEN AGE 10
- Page 265 and 266:
Annex 4.6PERCENTAGE OF NEW FAMILY P
- Page 267 and 268:
Annex 4.8PERCENTAGE OF ACTIVE FAMIL
- Page 269 and 270:
Lampiran 4.10NoProvincesCoverage of
- Page 271 and 272:
Annex 4.12PERCENTAGE OF NEONATES VI
- Page 273 and 274:
Annex 4.14COVERAGE OF INFANT AND UN
- Page 275 and 276:
Annex 4.16COVERAGE OF UNDERFIVE WEI
- Page 277 and 278:
Annex 4.18COVERAGE OF EXCLUSIVE BRE
- Page 279 and 280:
Annex 4.20TargetVitamin A CoverageN
- Page 281 and 282:
Annex 4.22PERCENTAGE OF CHILDREN AG
- Page 283 and 284:
Annex 4.24COVERAGE OF UNIVERSAL CHI
- Page 285 and 286:
Annex 4.26PERCENTAGE OF CHILDREN AG
- Page 287 and 288:
Annex 4.28DROP OUT RATE OF IMMUNIZA
- Page 289 and 290:
Annex 4.30NoProvincesNumber ofPregn
- Page 291 and 292:
Annex 4.32NoProvincesNumber ofFerti
- Page 293 and 294:
Annex 4.34PERCENTAGE OF TUBERCULOSI
- Page 295 and 296:
Annex 4.36NUMBER OF INPATIENT VISIT
- Page 297 and 298:
Annex 4.38EXAMINATION OF DENTAL AND
- Page 299 and 300:
Annex 4.43PERCENTAGE OF DRUG AND VA
- Page 301 and 302:
Annex 4.41NUMBER OF ADVANCE LEVEL I
- Page 303 and 304:
Annex 4.44PERCENTAGE OF DRUG AND VA
- Page 305 and 306:
Annex 5.2NoProvincesNumber of Healt
- Page 307 and 308:
Annex 5.4NUMBER OF HOSPITAL AND BED
- Page 309 and 310:
Annex 5.6NUMBER OF SPECIFIC HOSPITA
- Page 311 and 312:
Annex 5.8NUMBER OF PRODUCTION FACIL
- Page 313 and 314:
Annex 5.10NUMBER OF HEALTH EFFORT C
- Page 315 and 316:
Annex 5.12NUMBER OF NON HEALTH POLY
- Page 317 and 318:
Annex 5.14NUMBER OF NON POLYTECHNIC
- Page 319 and 320:
Annex 5.16RECAPITULATION OF POLTEKK
- Page 321 and 322:
Annex 5.18RECAPITULATION OF STUDENT
- Page 323 and 324:
Annex 5.20NUMBER OF POLTEKKES GRADU
- Page 325 and 326:
Annex 5.22RECAPITULATION OF HEALTH
- Page 327 and 328:
Annex 5.24RATIO OF PHYSICIAN, DENTI
- Page 329 and 330:
Annex 5.26RECAPITULATION OF PHYSICI
- Page 331 and 332:
Annex 5.28RECAPITULATION OF MIDWIFE
- Page 333 and 334:
Annex 5.30RECAPITULATION OF DENTIST
- Page 335 and 336:
Annex 5.33RECAPITULATION OF PHYSICI
- Page 337 and 338:
Annex 5.34RECAPITULATION OF DENTIST
- Page 339 and 340:
Annex 5.36DISTRIBUTION OF WIDYAISWA
- Page 341 and 342:
Annex 5.38ALLOCATION AND REALIZATIO
- Page 343 and 344:
Annex 5.40DISTRIBUTION OF MOH EMPLO
- Page 345 and 346:
Annex 6.2BIRTH RATE, MORTALITY RATE
- Page 347 and 348:
Annex 6.4TUBERCULOSIS IN ASEAN AND
- Page 349 and 350:
Annex 6.6NUMBER OF VACCINE-PREVENTA
- Page 351 and 352:
Annex 6.8HEALTH EFFORTS IN ASEAN AN