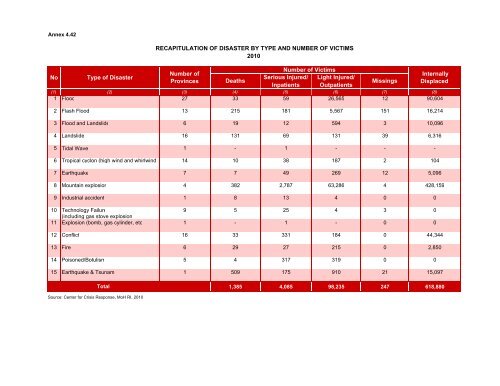
Annex 4.42NoType of DisasterRECAPITULATION OF DISASTER BY TYPE AND NUMBER OF VICTIMS<strong>2010</strong>Number ofProvincesDeathsNumber of VictimsSerious Injured/ Light Injured/Inpatients OutpatientsMissings(1) (2) (3) (4) (5) (6) (7) (8)1 Flood 27 33 59 26,565 12 90,6042 Flash Flood 13 215 181 5,567 151 16,2143 Flood and Landslide 6 19 12 594 3 10,0964 Landslide 16 131 69 131 39 6,3165 Tidal Wave 1 - 1 - - -6 Tropical cyclon (high wind and whirlwind 14 10 38 187 2 1047 Earthquake 7 7 49 269 12 5,0968 Mountain explosion 4 382 2,787 63,286 4 428,1599 Industrial accident 1 8 13 4 0 010 Technology Failure 9 5 25 4 3 0(including gas stove explosion11 Explosion (bomb, gas cylinder, etc 1 - 1 - 0 012 Conflict 16 33 331 184 0 44,34413 Fire 6 29 27 215 0 2,85014 Poisoned/Botulism 5 4 317 319 0 0InternallyDisplaced15 Earthquake & Tsunam 1 509 175 910 21 15,097Total1,385 4,085 98,235 247 618,880Source: Center for Crisis Response, MoH RI, <strong>2010</strong>
Annex 4.44PERCENTAGE OF DRUG AND VACCINE AVAILABILITY IN INDONESIAJUNE 2011Requirement AvailabilityRequirement AvailabilityNo Name of Drug Packing% Availability No Name of Drug Packing% Availability2011 on May 1, 20112011 on May 1, 20111 2 3 4 5 6 1 2 3 4 5 673 Chlorpheniramine maleat (CTM) tablet 4 mg 1,000 tablets / bottle 118,244,020 32,593,219 27 109 Povidone Iodine solution 10 % Bottle 30 ml 3,109,389 391,127 1774 Chlorpromazine injection i.m 5 mg/ml-2ml (HCL) 30 ampoules / box 405,042 86,694 65 110 Povidone Iodine solution 10 % Bottle 300 ml 1,935,411 282,816 2075 Chlorpromazine injection i.m 25 mg/ml (HCL) 30 ampoules / box 163,702 47,775 43 111 Prednisone tablet 5 mg 1,000 tablets / bottle 63,117,211 10,029,513 2576 Chlorpromazine coated tablet 25 mg (HCL) 1,000 tablets / bottle 702,320 189,932 33 112 Primaquine tablet 15 mg 1,000 tablets / bottle 1,897,705 595,454 5177 Chlorpromazine HCl coated tablet 100 mg (HCL) 1,000 tablets / bottle 1,855,256 401,878 28 113 Propiltiouracil tablet 100 mg 100 tablets / bottle 1,311,239 309,369 3178Anti Malaria DOEN combination Pirimetamin 25 mg +Sulfadoxin 500 mg100 tablets / box 1,736,825 324,088 23 114 Propanol tablet 40 mg (HCL) 100 tablets / bottle 2,745,337 738,014 2379Cotrimoxazol Suspension combination:Sulfametoxazol 200 mg + Trimetoprim 40 mg/ 5 mlbottle 60 ml 38,762,772 4,309,447 18 115 Reserpine tablet 0,10 mg 250 tablets / bottle 2,764,159 648,583 5780Cotrimoxazol DOEN I (adult) combination :Sulfametoxazol 400 mg, Trimetoprim 80 mgbox 10 x 10 tablets 37,124,662 7,546,260 17 116 Reserpine tablet 0,25 mg 1,000 tablets /bottle 5,446,174 1,665,516 4481Cotrimoxazol DOEN II (pediatric) combination :Sulfametoxazol 100 mg, Trimetoprim 20 mgbox 10 x 10 tablets 4,466,612 1,764,582 28 117 Ringer Lactate solution btl 500 ml 18,579,917 4,214,549 2182 Quinin tablet 200 mg box 60 tablets 976,507 280,228 27 118Salep 2-4, combination: Salicylic acid 2% +Sulphur precipitate 4%24 pot @ 30 g / box 2,026,650 427,644 2283 Quinin Dihydrochlorida injection 25%-2 ml 30 ampoules / box 193,037 39,731 40 119 Salicyl powder 2% 50 gram / box 12,416,968 1,863,237 1884Lidocain injection 2% (HCL) + Epinephrin 1 : 80.000-2Serum Anti Bisa Ular Polivalen injection 5 ml (ABU30 vial / box 2,734,233 391,139 24 120mlI)10 vial / box 750,723 168,102 2485 Magnesium Sulfat injection (IV) 20%-25 ml 10 vial / box 123,241 42,793 57 121Serum Anti Bisa Ular Polivalen injection 50 ml(ABU II)1 vial / box 26,989,177 9,751,206 7786 Magnesium Sulfat injection (IV) 40%-25 ml 10 vial / box 94,076 31,952 40 122Anti Diphteri Serum injection 20.000 IU/vial(A.D.S.)10 vial / box 2,542,110 541,783 1587 Magnesium Sulfat powder 30 gram 10 sachets @ 30 gr / box 113,839 25,512 24 123Anti Tetanus Serum injection 1.500 IU/ampul(A.T.S.)10 ampoules / box 768,798 123,754 1688 Mebendazol syrup 100 mg / 5 ml Bottle 30 ml 384,662 60,356 25 124Anti Tetanus Serum injection 20.000 IU/vial(A.T.S.)10 vial / box 1,175,676 326,911 2389 Mebendazol tablet 100 mg box 5 x 6 tablets 664,460 132,413 45 125 Cyanocobalamin (Vitamin B12) injection 500 mcg 100 ampoules / box 3,048,868 372,771 2290Metilergometrin Maleat (Metilergometrin) coated tablet0,125 mgbox 10 x 10 tablets 6,276,528 642,144 17 126 Sodium Sulfacetamide eye drops 15 % box 24 btl @ 5 ml 1,421,062 162,232 2091 Metilergometrin Maleat injeksi 0,200 mg -1 ml 30 ampoules / box 915,477 133,153 21 127 Tetracaine HCL eye drops 0,5% box 24 btl @ 5 ml 1,326,662 382,021 2292 Metronidazol tablet 250 mg 100 tablets / box 14,637,739 1,757,800 22 128 Tetracycline capsule 250 mg 1,000 capsule / bottle 23,069,009 3,998,051 2693 Sodium Bicarbonat tablet 500 mg 1,000 tablets / bottle 11,830,517 3,092,641 25 129 Tetracycline capsule 500 mg box 10 x 10 capsule 4,586,525 1,116,482 1694 Sodium Fluorescein eye drops 2 % 24 bottle @ 5 ml / box 955,865 217,853 38 130 Thiamine (vitamin B1) injection 100 mg/ml box 30 amp @ 1 ml 1,591,633 349,963 2695 Sodium Chlorida infusion 0,9 % Bottle / plastic 500 ml 3,180,697 397,650 17 131 Thiamine (vitamin B1) tablet 50 mg (HCL/Nitrat) 1,000 tablets / bottle 64,201,517 13,762,907 2796 Sodium Thiosulfat injection I.v. 25 % box 10 amp @ 10 ml 812,652 205,658 30 132 Tiopental Sodium powder injection 1,000 mg/amp ampoules @ 10 ml 65,554 21,934 3897 Nistatin coated tablet 500.000 IU/g box 10 x 10 coated tablets 521,661 128,033 31 133 Trihexyphenidil tablet 2 mg box 10 x 10 tablets 1,491,918 321,118 5098 Nistatin Vaginal coated tablet 100.000 IU/g box 10 x 10 vaginal tablets 886,078 195,732 29 134 Vaccine Rabies Vero 1 kuur / set 372,106 102,322 1699 Obat Batuk Hitam ( O.B.H.) Bottle 100 ml 28,227,179 4,208,101 18 135 Vitamin B Complex tablet 1,000 tablets / bottle 85,292,284 20,717,522 25100 Oxytetracycline HCL eye ointment 1 % 25 tube @ 3,5 g / box 2,346,931 498,100 19 VACCINE101 Oxytetracycline injection I.m. 50 mg/ml-10 ml 10 vial / box 491,460 69,872 18 136 BCG 2,099,247 680,411 19102 Oxytocin injection 10 UI/ml-1 ml 30 ampoules / box 2,591,294 482,981 19 137 T T 4,524,864 758,556 17103 Paracetamol syrup 120 mg / 5 ml Bottle 60 ml 47,219,120 6,475,166 17 138 D T 1,044,349 125,989 <strong>2010</strong>4 Paracetamol tablet 100 mg 100 tablets / bottle 3,467,807 1,469,499 35 139 CAMPAK 10 Doses 2,453,182 704,796 22105 Paracetamol tablet 500 mg 1,000 tablets / bottle 122,881,960 32,705,240 27 140 POLIO 10 Doses 4,122,780 1,008,969 18106 Pilokarpin eye drops 2 % (HCL/Nitrat) bottle @ 5 ml 914,892 262,425 22 141 DTP-HB 4,136,106 866,415 17107 Pyrantel tablet Score (base) 125 mg box 30 x 2 score 3,743,392 867,727 30 142 HEPATITIS B 0,5 ml ADS 4,545,648 1,192,320 19108 Pyridoxine (Vitamin B6) tablet 10 mg (HCL) 1,000 tablets / bottle 60,545,338 12,126,863 24 143 POLIO 20 Doses 548,251 16,135 10144 CAMPAK 20 Doses 321,972 8,152 16Source: DG of Phamaceutical and Medical Device, MoH RI
- Page 2 and 3:
351.770212IndIINDONESIA HEALTH PROF
- Page 4 and 5:
EDITOR OF BOARDAdvisordr. Ratna Ros
- Page 6 and 7:
This Indonesia Health Profile is pr
- Page 8 and 9:
FOREWORDACKNOWLEDGEMENT OF GENERAL
- Page 10 and 11:
Annex 2.1 Distribution of Governmen
- Page 12 and 13:
Annex 3.17 TB Period Prevalence (D)
- Page 14 and 15:
Annex 4.23 Percentage of Population
- Page 16 and 17:
Annex 5.21 Recapitulation of Gradua
- Page 19 and 20:
Ministry of Health's vision is "Hea
- Page 21:
population, birth rate, mortality r
- Page 24 and 25:
Population growth is the change in
- Page 26 and 27:
Age structure of population by sex
- Page 28 and 29:
km2. Provinces with the highest lev
- Page 30 and 31:
GRAPH 2.7DEPENDENCY RATIO BY PROVIN
- Page 32 and 33:
GRAPH 2.8PERCENTAGE OF UNEMPLOYMENT
- Page 34 and 35:
TABLE 2.3NUMBER OF UNDERDEVELOPED D
- Page 36 and 37:
Based on data of number of poor peo
- Page 38 and 39:
GRAPH 2.12PERCENTAGE OF HOUSEHOLD B
- Page 40 and 41:
GRAPH 2.14PERCENTAGE OF HOUSEHOLD B
- Page 42 and 43:
GRAPH 2.16PERCENTAGE OF PEOPLE AGE
- Page 44 and 45:
GRAPH 2.18PERCENTAGE OF WOMEN AGE 1
- Page 47 and 48:
There are several indicators used o
- Page 49 and 50:
2. Underfive Mortality Rate (UMR)Un
- Page 51 and 52:
4. Crude Death RateCrude Death Rate
- Page 53 and 54:
No1234TABEL 3.110 MAIN DISEASES ON
- Page 55 and 56:
Chronic nutrition problem indicated
- Page 57 and 58:
Educationlevel ofparentsTABLE 3.5PR
- Page 59 and 60:
DG of Diasease Control and Environm
- Page 61 and 62:
GRAPH 3.10CASE DETECTION RATE (CDR)
- Page 63 and 64:
c. HIV/AIDSHIV/AIDS is one of commu
- Page 65 and 66:
GRAPH 3.15PERCENTAGE OF AIDS CUMULA
- Page 67 and 68:
GRAPH 3.18NUMBER OF PAUCI BACILLARY
- Page 69 and 70:
GRAPH 3.21PREVALENCE OF YAWS IN IND
- Page 71 and 72:
GRAPH 3.23NUMBER OF DIPTHERIA CASES
- Page 73 and 74:
GRAPH 3.25INCIDENCE RATE OF DHF PER
- Page 75 and 76:
GRAPH 3.29CASE FATALITY RATE (CFR)
- Page 77 and 78:
Above graph shows rising trend of G
- Page 79 and 80:
g. LeptospirosisLeptospirosis is tr
- Page 81:
There were three provinces with hig
- Page 84 and 85:
Survey (SDKI) 2007 recorded MMR 228
- Page 86 and 87:
Graph 4.2 presents achievement of K
- Page 88 and 89:
. Delivery Attendance by Midwifery
- Page 90 and 91:
access of delivery mother to health
- Page 92 and 93:
GRAPH 4.9COVERAGE OF POSTPARTUM CAR
- Page 94 and 95:
Polindes (village maternal clinic),
- Page 96 and 97:
GRAPH 4.14COVERAGE OF COMPLETE NEON
- Page 98 and 99:
g. Underfive Health CareUnderfive h
- Page 100 and 101:
GRAPH 4.19COVERAGE OF PRIMARY SCHOO
- Page 102 and 103:
By sex, method of contraceptive use
- Page 104 and 105:
Of 33 provinces in Indonesia, 20 pr
- Page 106 and 107:
Drop out rate of DPT‐Hb1‐measle
- Page 108 and 109:
Annex 4.43 and Annex 4.44 show drug
- Page 110 and 111:
Other indicator of hospital service
- Page 112 and 113:
In 2010, there were 36.23 million v
- Page 114 and 115:
temperature must be between 0‐8º
- Page 116 and 117:
has increased significantly from 20
- Page 118 and 119:
106Average coverage of pneumonia ca
- Page 120 and 121:
Batam and Mataram. In 2010, it was
- Page 122 and 123:
110Second‐level physical defect c
- Page 124 and 125:
districts/municipalities (25%) of f
- Page 126 and 127:
Monitoring of malaria vector suscep
- Page 128 and 129:
1. Iron (Fe) Tablet Supplementation
- Page 130 and 131:
GRAPH 4.51PERCENTAGE OF WOMEN SWALL
- Page 132 and 133:
GRAPH 4.53PERCENTAGE OF UNDERFIVE G
- Page 134 and 135:
122were West Nusa Tenggara, Bengkul
- Page 136 and 137:
encouraging mother to breastfeed ba
- Page 138:
people by type of disaster and vict
- Page 141 and 142:
GRAPH 5.1RATIO OF HEALTH CENTER PER
- Page 143 and 144:
Table 5.1 below shows the developme
- Page 145 and 146:
GRAPH 5.6NUMBER OF SPECIALTY HOSPIT
- Page 147 and 148:
Proportion of beds in general hospi
- Page 149 and 150:
While distribution facilities of ph
- Page 151 and 152:
GRAPH 5.14RATIO OF POSKESDES TO VIL
- Page 153 and 154:
Graph 5.17 shows number of majors/s
- Page 155 and 156:
Number of Diknakes institutions of
- Page 157 and 158:
Health human resources data had alr
- Page 159 and 160:
In 2010 there were 120 specialist d
- Page 161 and 162:
physicians and 112 dentists. Graph
- Page 163 and 164:
anging from 6 to 14 lecturers. Whil
- Page 165:
Participants of National Community
- Page 168 and 169:
GRAPH 6.1POPULATION IN ASEAN & SEAR
- Page 170 and 171:
In SEARO region, Timor Leste had th
- Page 172 and 173:
By those key indicators, in 2010, t
- Page 174 and 175:
GRAPH 6.8GROSS NATIONAL INCOME (GNI
- Page 176 and 177:
Data in “World Health Statistics
- Page 178 and 179:
Indonesia was on the 2 nd lowest po
- Page 180 and 181:
Avian Influenza firstly entered ASE
- Page 182 and 183:
Indonesia, which in 2005 got the ou
- Page 184 and 185:
GRAPH 6.17COVERAGE OF VACCINATIONIN
- Page 186 and 187:
3. Improved DrinkingWater Source
- Page 188 and 189:
BPS Statistics Indonesia. 2006. Est
- Page 190:
___________. 2005. Publikasi Hasil
- Page 193 and 194:
Annex 2.2TOTAL POPULATION BY SEX AN
- Page 195 and 196:
Annex 2.4POPULATION GROWTH RATEBY P
- Page 197 and 198:
Annex 2.6NUMBER OF POPULATION BY SE
- Page 199 and 200:
Annex 2.838 DISTRICTS AS PRIORITY A
- Page 201 and 202:
Annex 2.10NUMBER AND PERCENTAGE OF
- Page 203 and 204:
Annex 2.12PERCENTAGE OF HOUSEHOLDS
- Page 205 and 206:
Annex 2.14PERCENTAGE OF HOUSEHOLDS
- Page 207 and 208:
Annex 2.16PERCENTAGE OF HOUSEHOLDS
- Page 209 and 210:
Annex 2.18PERCENTAGE OF HOUSEHOLDS
- Page 211 and 212:
Annex 2.20PERCENTAGE OF HOUSEHOLDS
- Page 213 and 214:
Annex 2.22PERCENTAGE OF HOUSEHOLDS
- Page 215 and 216:
Annex 2.24PREVALENCE OF SMOKERS 15
- Page 217 and 218:
Annex 2.26PERCENTAGE OF WOMEN AGED
- Page 219 and 220:
Annex 3.1ESTIMATION OF INFANT MORTA
- Page 221 and 222:
Annex 3.310 MAIN DISEASES OF HOSPIT
- Page 223 and 224:
Annex 3.5PREVALENCE OF UNDERFIVE NU
- Page 225 and 226:
Annex 3.7PREVALENCE OF UNDERFIVE NU
- Page 227 and 228:
Annex 3.9PREVALENCE OF ADULT NUTRIT
- Page 229 and 230:
Annex 3.11ANNUAL PARASITE INSIDENCE
- Page 231 and 232:
Annex 3.13Detection CoverageNo Prov
- Page 233 and 234:
Annex 3.15NoProvinces(1) (2) (3) (4
- Page 235 and 236:
Annex 3.17TB PERIOD PREVALENCE (D)
- Page 237 and 238:
Annex 3.19NoProvincesAIDS CUMULATIV
- Page 239 and 240:
Annex 3.21NUMBER OF UNDERFIVE PNEUM
- Page 241 and 242:
Annex 3.23NUMBER OF TETANUS NEONATO
- Page 243 and 244:
Annex 3.25NUMBER OF MEASLES CASESBY
- Page 245 and 246:
Annex 3.27OUTBREAK FREQUENCY AND NU
- Page 247 and 248:
Annex 3.29NUMBER OF DIPHTERIA CASES
- Page 249 and 250:
Annex 3.31NUMBER OF AFP CASES AND N
- Page 251 and 252: Annex 3.33NUMBER OF DISTRICTS/MUNIC
- Page 253 and 254: Annex 3.35NUMBER OF CHIKUNGUNYA CAS
- Page 255 and 256: Annex 3.37NUMBER OF FILARIASIS CASE
- Page 257 and 258: Annex 3.39NUMBER OF LEPTOSPYROSIS C
- Page 259 and 260: Annex 3.41NUMBER OF AVIAN INFLUENZA
- Page 261 and 262: Annex 4.2PERCENTAGE OF WOMEN AGE 10
- Page 263 and 264: Annex 4.4PERCENTAGE OF WOMEN AGE 10
- Page 265 and 266: Annex 4.6PERCENTAGE OF NEW FAMILY P
- Page 267 and 268: Annex 4.8PERCENTAGE OF ACTIVE FAMIL
- Page 269 and 270: Lampiran 4.10NoProvincesCoverage of
- Page 271 and 272: Annex 4.12PERCENTAGE OF NEONATES VI
- Page 273 and 274: Annex 4.14COVERAGE OF INFANT AND UN
- Page 275 and 276: Annex 4.16COVERAGE OF UNDERFIVE WEI
- Page 277 and 278: Annex 4.18COVERAGE OF EXCLUSIVE BRE
- Page 279 and 280: Annex 4.20TargetVitamin A CoverageN
- Page 281 and 282: Annex 4.22PERCENTAGE OF CHILDREN AG
- Page 283 and 284: Annex 4.24COVERAGE OF UNIVERSAL CHI
- Page 285 and 286: Annex 4.26PERCENTAGE OF CHILDREN AG
- Page 287 and 288: Annex 4.28DROP OUT RATE OF IMMUNIZA
- Page 289 and 290: Annex 4.30NoProvincesNumber ofPregn
- Page 291 and 292: Annex 4.32NoProvincesNumber ofFerti
- Page 293 and 294: Annex 4.34PERCENTAGE OF TUBERCULOSI
- Page 295 and 296: Annex 4.36NUMBER OF INPATIENT VISIT
- Page 297 and 298: Annex 4.38EXAMINATION OF DENTAL AND
- Page 299 and 300: Annex 4.43PERCENTAGE OF DRUG AND VA
- Page 301: Annex 4.41NUMBER OF ADVANCE LEVEL I
- Page 305 and 306: Annex 5.2NoProvincesNumber of Healt
- Page 307 and 308: Annex 5.4NUMBER OF HOSPITAL AND BED
- Page 309 and 310: Annex 5.6NUMBER OF SPECIFIC HOSPITA
- Page 311 and 312: Annex 5.8NUMBER OF PRODUCTION FACIL
- Page 313 and 314: Annex 5.10NUMBER OF HEALTH EFFORT C
- Page 315 and 316: Annex 5.12NUMBER OF NON HEALTH POLY
- Page 317 and 318: Annex 5.14NUMBER OF NON POLYTECHNIC
- Page 319 and 320: Annex 5.16RECAPITULATION OF POLTEKK
- Page 321 and 322: Annex 5.18RECAPITULATION OF STUDENT
- Page 323 and 324: Annex 5.20NUMBER OF POLTEKKES GRADU
- Page 325 and 326: Annex 5.22RECAPITULATION OF HEALTH
- Page 327 and 328: Annex 5.24RATIO OF PHYSICIAN, DENTI
- Page 329 and 330: Annex 5.26RECAPITULATION OF PHYSICI
- Page 331 and 332: Annex 5.28RECAPITULATION OF MIDWIFE
- Page 333 and 334: Annex 5.30RECAPITULATION OF DENTIST
- Page 335 and 336: Annex 5.33RECAPITULATION OF PHYSICI
- Page 337 and 338: Annex 5.34RECAPITULATION OF DENTIST
- Page 339 and 340: Annex 5.36DISTRIBUTION OF WIDYAISWA
- Page 341 and 342: Annex 5.38ALLOCATION AND REALIZATIO
- Page 343 and 344: Annex 5.40DISTRIBUTION OF MOH EMPLO
- Page 345 and 346: Annex 6.2BIRTH RATE, MORTALITY RATE
- Page 347 and 348: Annex 6.4TUBERCULOSIS IN ASEAN AND
- Page 349 and 350: Annex 6.6NUMBER OF VACCINE-PREVENTA
- Page 351 and 352: Annex 6.8HEALTH EFFORTS IN ASEAN AN