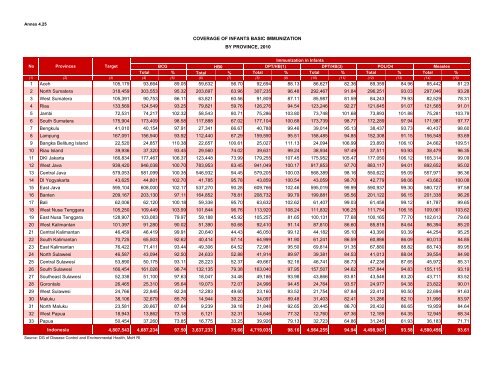
Annex 4.25COVERAGE OF INFANTS BASIC IMMUNIZATIONBY PROVINCE, <strong>2010</strong>Immunization in InfantsNo Provinces TargetBCGHB0 DPT/HB(1) DPT/HB(3) POLIO4 MeaslesTotal % Total % Total % Total % Total % Total %(1) (2) (3) (4) (5) (6) (7) (8) (9) (10) (11) (12) (13) (14) (15)1 Aceh 105,179 93,664 89.05 59,632 56.70 92,694 88.13 86,627 82.36 89,359 84.96 85,442 81.232 North Sumatera 318,459 303,553 95.32 203,697 63.96 307,235 96.48 292,467 91.84 296,251 93.03 297,046 93.283 West Sumatera 105,391 90,753 86.11 63,821 60.56 91,809 87.11 85,987 81.59 84,243 79.93 82,529 78.314 Riau 133,569 124,549 93.25 79,821 59.76 126,276 94.54 123,246 92.27 121,645 91.07 121,565 91.015 Jambi 72,531 74,217 102.32 58,543 80.71 75,286 103.80 73,748 101.68 73,893 101.88 75,281 103.796 South Sumatera 175,904 173,409 98.58 117,888 67.02 177,104 100.68 173,739 98.77 172,289 97.94 171,987 97.777 Bengkulu 41,010 40,154 97.91 27,341 66.67 40,788 99.46 39,014 95.13 38,437 93.73 40,437 98.608 Lampung 167,091 156,940 93.92 112,440 67.29 159,590 95.51 158,485 94.85 152,308 91.15 156,548 93.699 Bangka Belitung Island 22,520 24,857 110.38 22,657 100.61 25,027 111.13 24,094 106.99 23,893 106.10 24,662 109.5110 Riau Island 39,936 37,320 93.45 29,560 74.02 39,631 99.24 38,934 97.49 37,511 93.93 38,479 96.3511 DKI Jakarta 166,834 177,467 106.37 123,448 73.99 179,255 107.45 175,952 105.47 177,050 106.12 165,314 99.0912 West Java 939,420 946,038 100.70 783,953 83.45 941,049 100.17 917,853 97.70 883,117 94.01 892,652 95.0213 Central Java 579,053 581,099 100.35 546,932 94.45 579,205 100.03 568,389 98.16 550,622 95.09 557,971 96.3614 DI Yogyakarta 43,625 44,801 102.70 41,785 95.78 43,859 100.54 43,059 98.70 42,779 98.06 43,662 100.0815 East Java 595,104 608,000 102.17 537,270 90.28 609,766 102.46 595,019 99.99 590,937 99.30 580,727 97.5816 Banten 209,167 203,130 97.11 164,852 78.81 208,732 99.79 199,881 95.56 201,122 96.15 201,338 96.2617 Bali 62,006 62,120 100.18 59,338 95.70 63,632 102.62 61,407 99.03 61,458 99.12 61,787 99.6518 West Nusa Tenggara 105,250 109,449 103.99 101,844 96.76 113,920 108.24 111,832 106.25 111,754 106.18 109,061 103.6219 East Nusa Tenggara 128,907 103,083 79.97 59,188 45.92 105,257 81.65 100,131 77.68 100,165 77.70 102,613 79.6020 West Kalimantan 101,397 91,280 90.02 51,390 50.68 92,410 91.14 87,810 86.60 85,818 84.64 86,394 85.2021 Central Kalimantan 46,459 46,419 99.91 20,640 44.43 46,050 99.12 44,182 95.10 43,390 93.39 44,254 95.2522 South Kalimantan 70,725 65,503 92.62 40,414 57.14 64,999 91.90 61,241 86.59 60,886 86.09 60,013 84.8523 East Kalimantan 76,422 71,411 93.44 49,306 64.52 72,981 95.50 69,814 91.35 67,880 88.82 68,743 89.9524 North Sulawesi 46,587 43,094 92.50 24,633 52.88 41,914 89.97 39,381 84.53 41,013 88.04 39,554 84.9025 Central Sulawesi 53,890 50,175 93.11 28,223 52.37 49,667 92.16 46,741 86.73 47,236 87.65 45,972 85.3126 South Sulawesi 166,454 161,026 96.74 132,135 79.38 163,040 97.95 157,507 94.62 157,844 94.83 155,115 93.1927 Southeast Sulawesi 52,338 51,100 97.63 18,047 34.48 49,186 93.98 43,866 83.81 43,546 83.20 43,711 83.5228 Gorontalo 26,465 25,310 95.64 19,073 72.07 24,996 94.45 24,764 93.57 24,977 94.38 23,822 90.0129 West Sulawesi 24,766 22,845 92.24 12,283 49.60 23,160 93.52 21,754 87.84 22,412 90.50 22,694 91.6330 Maluku 38,106 32,679 85.76 14,944 39.22 34,097 89.48 31,403 82.41 31,286 82.10 31,996 83.9731 North Maluku 23,581 20,667 87.64 9,239 39.18 21,848 92.65 20,445 86.70 20,432 86.65 19,959 84.6432 West Papua 18,943 13,862 73.18 6,121 32.31 14,646 77.32 12,760 67.36 12,189 64.35 12,945 68.3433 Papua 50,454 37,260 73.85 16,775 33.25 39,926 79.13 32,723 64.86 31,245 61.93 36,183 71.71<strong>Indonesia</strong>4,807,543 4,687,234 97.50 3,637,233 75.66 4,719,035 98.16 4,564,255 94.94 4,498,987 93.58 4,500,456 93.61Source: DG of Disease Control and Environmental <strong>Health</strong>, MoH RI
Annex 4.26PERCENTAGE OF CHILDREN AGE 12-23 MONTHS GETTING BASIC IMMUNIZATION BY PROVINCE,RISKESDAS <strong>2010</strong>No ProvincesBasic ImmunizationBCG Polio 4 DPT-HB3 Measles(1) (2) (3) (4) (5) (6)1 Aceh 57.3 52.4 40.2 62.22 North Sumatera 56.9 49.6 43.5 58.13 West Sumatera 71.8 63.5 51.0 66.34 Riau 63.3 53.9 50.0 61.75 Jambi 78.6 72.9 65.7 72.56 South Sumatera 72.1 57.4 53.9 73.67 Bengkulu 74.2 62.1 51.6 73.38 Lampung 80.6 77.4 72.9 83.59 Bangka Belitung Island 87.1 77.4 72.4 76.710 Riau Island 89.7 84.6 79.5 92.111 DKI Jakarta 89.3 68.6 62.5 76.712 West Java 80.9 67.2 61.4 72.813 Central Java 90.1 80.2 77.5 86.214 DI Yogyakarta 100.0 96.4 96.4 96.415 East Java 83.0 77.3 74.2 81.616 Banten 76.3 64.5 57.7 69.317 Bali 83.6 78.6 72.7 83.618 West Nusa Tenggara 90.1 70.3 69.2 87.019 East Nusa Tenggara 75.2 45.3 41.9 76.120 West Kalimantan 63.9 58.3 57.7 60.421 Central Kalimantan 81.0 64.3 62.8 83.322 South Kalimantan 76.3 67.1 60.0 70.023 East Kalimantan 83.3 73.1 70.5 80.824 North Sulawesi 86.7 73.3 70.0 90.025 Central Sulawesi 60.0 49.2 44.6 62.126 South Sulawesi 77.6 65.2 57.8 77.027 Southeast Sulawesi 65.3 50.0 44.9 66.728 Gorontalo 72.7 56.5 52.2 68.229 West Sulawesi 60.7 46.4 35.7 57.130 Maluku 76.7 58.6 56.7 63.331 North Maluku 64.3 55.2 57.1 65.532 West Papua 65.2 50.0 45.5 73.933 Papua 53.6 40.5 36.5 47.1<strong>Indonesia</strong>77.9 66.7 61.9 74.4Source: National Board of <strong>Health</strong> Research and Development, MoH RI, Riskesdas <strong>2010</strong>
- Page 2 and 3:
351.770212IndIINDONESIA HEALTH PROF
- Page 4 and 5:
EDITOR OF BOARDAdvisordr. Ratna Ros
- Page 6 and 7:
This Indonesia Health Profile is pr
- Page 8 and 9:
FOREWORDACKNOWLEDGEMENT OF GENERAL
- Page 10 and 11:
Annex 2.1 Distribution of Governmen
- Page 12 and 13:
Annex 3.17 TB Period Prevalence (D)
- Page 14 and 15:
Annex 4.23 Percentage of Population
- Page 16 and 17:
Annex 5.21 Recapitulation of Gradua
- Page 19 and 20:
Ministry of Health's vision is "Hea
- Page 21:
population, birth rate, mortality r
- Page 24 and 25:
Population growth is the change in
- Page 26 and 27:
Age structure of population by sex
- Page 28 and 29:
km2. Provinces with the highest lev
- Page 30 and 31:
GRAPH 2.7DEPENDENCY RATIO BY PROVIN
- Page 32 and 33:
GRAPH 2.8PERCENTAGE OF UNEMPLOYMENT
- Page 34 and 35:
TABLE 2.3NUMBER OF UNDERDEVELOPED D
- Page 36 and 37:
Based on data of number of poor peo
- Page 38 and 39:
GRAPH 2.12PERCENTAGE OF HOUSEHOLD B
- Page 40 and 41:
GRAPH 2.14PERCENTAGE OF HOUSEHOLD B
- Page 42 and 43:
GRAPH 2.16PERCENTAGE OF PEOPLE AGE
- Page 44 and 45:
GRAPH 2.18PERCENTAGE OF WOMEN AGE 1
- Page 47 and 48:
There are several indicators used o
- Page 49 and 50:
2. Underfive Mortality Rate (UMR)Un
- Page 51 and 52:
4. Crude Death RateCrude Death Rate
- Page 53 and 54:
No1234TABEL 3.110 MAIN DISEASES ON
- Page 55 and 56:
Chronic nutrition problem indicated
- Page 57 and 58:
Educationlevel ofparentsTABLE 3.5PR
- Page 59 and 60:
DG of Diasease Control and Environm
- Page 61 and 62:
GRAPH 3.10CASE DETECTION RATE (CDR)
- Page 63 and 64:
c. HIV/AIDSHIV/AIDS is one of commu
- Page 65 and 66:
GRAPH 3.15PERCENTAGE OF AIDS CUMULA
- Page 67 and 68:
GRAPH 3.18NUMBER OF PAUCI BACILLARY
- Page 69 and 70:
GRAPH 3.21PREVALENCE OF YAWS IN IND
- Page 71 and 72:
GRAPH 3.23NUMBER OF DIPTHERIA CASES
- Page 73 and 74:
GRAPH 3.25INCIDENCE RATE OF DHF PER
- Page 75 and 76:
GRAPH 3.29CASE FATALITY RATE (CFR)
- Page 77 and 78:
Above graph shows rising trend of G
- Page 79 and 80:
g. LeptospirosisLeptospirosis is tr
- Page 81:
There were three provinces with hig
- Page 84 and 85:
Survey (SDKI) 2007 recorded MMR 228
- Page 86 and 87:
Graph 4.2 presents achievement of K
- Page 88 and 89:
. Delivery Attendance by Midwifery
- Page 90 and 91:
access of delivery mother to health
- Page 92 and 93:
GRAPH 4.9COVERAGE OF POSTPARTUM CAR
- Page 94 and 95:
Polindes (village maternal clinic),
- Page 96 and 97:
GRAPH 4.14COVERAGE OF COMPLETE NEON
- Page 98 and 99:
g. Underfive Health CareUnderfive h
- Page 100 and 101:
GRAPH 4.19COVERAGE OF PRIMARY SCHOO
- Page 102 and 103:
By sex, method of contraceptive use
- Page 104 and 105:
Of 33 provinces in Indonesia, 20 pr
- Page 106 and 107:
Drop out rate of DPT‐Hb1‐measle
- Page 108 and 109:
Annex 4.43 and Annex 4.44 show drug
- Page 110 and 111:
Other indicator of hospital service
- Page 112 and 113:
In 2010, there were 36.23 million v
- Page 114 and 115:
temperature must be between 0‐8º
- Page 116 and 117:
has increased significantly from 20
- Page 118 and 119:
106Average coverage of pneumonia ca
- Page 120 and 121:
Batam and Mataram. In 2010, it was
- Page 122 and 123:
110Second‐level physical defect c
- Page 124 and 125:
districts/municipalities (25%) of f
- Page 126 and 127:
Monitoring of malaria vector suscep
- Page 128 and 129:
1. Iron (Fe) Tablet Supplementation
- Page 130 and 131:
GRAPH 4.51PERCENTAGE OF WOMEN SWALL
- Page 132 and 133:
GRAPH 4.53PERCENTAGE OF UNDERFIVE G
- Page 134 and 135:
122were West Nusa Tenggara, Bengkul
- Page 136 and 137:
encouraging mother to breastfeed ba
- Page 138:
people by type of disaster and vict
- Page 141 and 142:
GRAPH 5.1RATIO OF HEALTH CENTER PER
- Page 143 and 144:
Table 5.1 below shows the developme
- Page 145 and 146:
GRAPH 5.6NUMBER OF SPECIALTY HOSPIT
- Page 147 and 148:
Proportion of beds in general hospi
- Page 149 and 150:
While distribution facilities of ph
- Page 151 and 152:
GRAPH 5.14RATIO OF POSKESDES TO VIL
- Page 153 and 154:
Graph 5.17 shows number of majors/s
- Page 155 and 156:
Number of Diknakes institutions of
- Page 157 and 158:
Health human resources data had alr
- Page 159 and 160:
In 2010 there were 120 specialist d
- Page 161 and 162:
physicians and 112 dentists. Graph
- Page 163 and 164:
anging from 6 to 14 lecturers. Whil
- Page 165:
Participants of National Community
- Page 168 and 169:
GRAPH 6.1POPULATION IN ASEAN & SEAR
- Page 170 and 171:
In SEARO region, Timor Leste had th
- Page 172 and 173:
By those key indicators, in 2010, t
- Page 174 and 175:
GRAPH 6.8GROSS NATIONAL INCOME (GNI
- Page 176 and 177:
Data in “World Health Statistics
- Page 178 and 179:
Indonesia was on the 2 nd lowest po
- Page 180 and 181:
Avian Influenza firstly entered ASE
- Page 182 and 183:
Indonesia, which in 2005 got the ou
- Page 184 and 185:
GRAPH 6.17COVERAGE OF VACCINATIONIN
- Page 186 and 187:
3. Improved DrinkingWater Source
- Page 188 and 189:
BPS Statistics Indonesia. 2006. Est
- Page 190:
___________. 2005. Publikasi Hasil
- Page 193 and 194:
Annex 2.2TOTAL POPULATION BY SEX AN
- Page 195 and 196:
Annex 2.4POPULATION GROWTH RATEBY P
- Page 197 and 198:
Annex 2.6NUMBER OF POPULATION BY SE
- Page 199 and 200:
Annex 2.838 DISTRICTS AS PRIORITY A
- Page 201 and 202:
Annex 2.10NUMBER AND PERCENTAGE OF
- Page 203 and 204:
Annex 2.12PERCENTAGE OF HOUSEHOLDS
- Page 205 and 206:
Annex 2.14PERCENTAGE OF HOUSEHOLDS
- Page 207 and 208:
Annex 2.16PERCENTAGE OF HOUSEHOLDS
- Page 209 and 210:
Annex 2.18PERCENTAGE OF HOUSEHOLDS
- Page 211 and 212:
Annex 2.20PERCENTAGE OF HOUSEHOLDS
- Page 213 and 214:
Annex 2.22PERCENTAGE OF HOUSEHOLDS
- Page 215 and 216:
Annex 2.24PREVALENCE OF SMOKERS 15
- Page 217 and 218:
Annex 2.26PERCENTAGE OF WOMEN AGED
- Page 219 and 220:
Annex 3.1ESTIMATION OF INFANT MORTA
- Page 221 and 222:
Annex 3.310 MAIN DISEASES OF HOSPIT
- Page 223 and 224:
Annex 3.5PREVALENCE OF UNDERFIVE NU
- Page 225 and 226:
Annex 3.7PREVALENCE OF UNDERFIVE NU
- Page 227 and 228:
Annex 3.9PREVALENCE OF ADULT NUTRIT
- Page 229 and 230:
Annex 3.11ANNUAL PARASITE INSIDENCE
- Page 231 and 232:
Annex 3.13Detection CoverageNo Prov
- Page 233 and 234: Annex 3.15NoProvinces(1) (2) (3) (4
- Page 235 and 236: Annex 3.17TB PERIOD PREVALENCE (D)
- Page 237 and 238: Annex 3.19NoProvincesAIDS CUMULATIV
- Page 239 and 240: Annex 3.21NUMBER OF UNDERFIVE PNEUM
- Page 241 and 242: Annex 3.23NUMBER OF TETANUS NEONATO
- Page 243 and 244: Annex 3.25NUMBER OF MEASLES CASESBY
- Page 245 and 246: Annex 3.27OUTBREAK FREQUENCY AND NU
- Page 247 and 248: Annex 3.29NUMBER OF DIPHTERIA CASES
- Page 249 and 250: Annex 3.31NUMBER OF AFP CASES AND N
- Page 251 and 252: Annex 3.33NUMBER OF DISTRICTS/MUNIC
- Page 253 and 254: Annex 3.35NUMBER OF CHIKUNGUNYA CAS
- Page 255 and 256: Annex 3.37NUMBER OF FILARIASIS CASE
- Page 257 and 258: Annex 3.39NUMBER OF LEPTOSPYROSIS C
- Page 259 and 260: Annex 3.41NUMBER OF AVIAN INFLUENZA
- Page 261 and 262: Annex 4.2PERCENTAGE OF WOMEN AGE 10
- Page 263 and 264: Annex 4.4PERCENTAGE OF WOMEN AGE 10
- Page 265 and 266: Annex 4.6PERCENTAGE OF NEW FAMILY P
- Page 267 and 268: Annex 4.8PERCENTAGE OF ACTIVE FAMIL
- Page 269 and 270: Lampiran 4.10NoProvincesCoverage of
- Page 271 and 272: Annex 4.12PERCENTAGE OF NEONATES VI
- Page 273 and 274: Annex 4.14COVERAGE OF INFANT AND UN
- Page 275 and 276: Annex 4.16COVERAGE OF UNDERFIVE WEI
- Page 277 and 278: Annex 4.18COVERAGE OF EXCLUSIVE BRE
- Page 279 and 280: Annex 4.20TargetVitamin A CoverageN
- Page 281 and 282: Annex 4.22PERCENTAGE OF CHILDREN AG
- Page 283: Annex 4.24COVERAGE OF UNIVERSAL CHI
- Page 287 and 288: Annex 4.28DROP OUT RATE OF IMMUNIZA
- Page 289 and 290: Annex 4.30NoProvincesNumber ofPregn
- Page 291 and 292: Annex 4.32NoProvincesNumber ofFerti
- Page 293 and 294: Annex 4.34PERCENTAGE OF TUBERCULOSI
- Page 295 and 296: Annex 4.36NUMBER OF INPATIENT VISIT
- Page 297 and 298: Annex 4.38EXAMINATION OF DENTAL AND
- Page 299 and 300: Annex 4.43PERCENTAGE OF DRUG AND VA
- Page 301 and 302: Annex 4.41NUMBER OF ADVANCE LEVEL I
- Page 303 and 304: Annex 4.44PERCENTAGE OF DRUG AND VA
- Page 305 and 306: Annex 5.2NoProvincesNumber of Healt
- Page 307 and 308: Annex 5.4NUMBER OF HOSPITAL AND BED
- Page 309 and 310: Annex 5.6NUMBER OF SPECIFIC HOSPITA
- Page 311 and 312: Annex 5.8NUMBER OF PRODUCTION FACIL
- Page 313 and 314: Annex 5.10NUMBER OF HEALTH EFFORT C
- Page 315 and 316: Annex 5.12NUMBER OF NON HEALTH POLY
- Page 317 and 318: Annex 5.14NUMBER OF NON POLYTECHNIC
- Page 319 and 320: Annex 5.16RECAPITULATION OF POLTEKK
- Page 321 and 322: Annex 5.18RECAPITULATION OF STUDENT
- Page 323 and 324: Annex 5.20NUMBER OF POLTEKKES GRADU
- Page 325 and 326: Annex 5.22RECAPITULATION OF HEALTH
- Page 327 and 328: Annex 5.24RATIO OF PHYSICIAN, DENTI
- Page 329 and 330: Annex 5.26RECAPITULATION OF PHYSICI
- Page 331 and 332: Annex 5.28RECAPITULATION OF MIDWIFE
- Page 333 and 334: Annex 5.30RECAPITULATION OF DENTIST
- Page 335 and 336:
Annex 5.33RECAPITULATION OF PHYSICI
- Page 337 and 338:
Annex 5.34RECAPITULATION OF DENTIST
- Page 339 and 340:
Annex 5.36DISTRIBUTION OF WIDYAISWA
- Page 341 and 342:
Annex 5.38ALLOCATION AND REALIZATIO
- Page 343 and 344:
Annex 5.40DISTRIBUTION OF MOH EMPLO
- Page 345 and 346:
Annex 6.2BIRTH RATE, MORTALITY RATE
- Page 347 and 348:
Annex 6.4TUBERCULOSIS IN ASEAN AND
- Page 349 and 350:
Annex 6.6NUMBER OF VACCINE-PREVENTA
- Page 351 and 352:
Annex 6.8HEALTH EFFORTS IN ASEAN AN