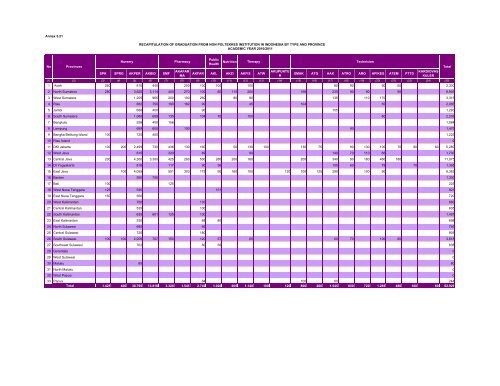
Annex 5.21RECAPITULATION OF GRADUATION FROM NON POLTEKKES INSTITUTION IN INDONESIA BY TYPE AND PROVINCEACADEMIC YEAR <strong>2010</strong>/2011NoProvincesNurserySPK SPRG AKPER AKBID SMFPharmacyAKAFARMAAKFARPublic<strong>Health</strong>AKLNutritionAKZITherapy(1) (2) (3) (4) (5) (6) (7) (8) (9) (10) (11) (12) (13) (14) (15) (16) (17) (18) (19) (20) (21) (23) (24) (25)1 Aceh 260 810 440 200 100 100 100 80 90 90 60 2,3302 North Sumatera 280 3,620 3,114 400 270 100 80 115 260 166 230 90 90 90 8,9053 West Sumatera 1,205 965 200 100 260 80 90 135 110 170 3,3154 Riau 682 750 180 182 90 45 104 50 2,0835 Jambi 688 400 90 105 1,2836 South Sumatera 1,060 659 135 104 70 100 80 2,2087 Bengkulu 528 400 156 1,0848 Lampung 689 600 100 90 1,4799 Bangka Belitung Island 100 725 400 1,22510 Riau Island 011 DKI Jakarta 100 200 2,499 730 436 130 160 50 130 100 130 75 90 130 100 70 90 60 5,28012 West Java 815 320 89 90 140 70 110 66 1,70013 Central Java 200 4,300 3,300 425 260 500 280 200 160 200 340 90 180 460 180 11,07514 DI Yogyakarta 818 117 90 56 105 60 79 70 1,39515 East Java 100 4,055 551 303 179 90 160 100 120 100 125 290 100 90 6,36316 Banten 550 750 1,30017 Bali 100 125 22518 West Nusa Tenggara 125 545 151 82119 East Nusa Tenggara 160 560 72020 West Kalimantan 750 130 88021 Central Kalimantan 535 100 63522 South Kalimantan 635 601 125 130 1,49123 East Kalimantan 530 88 80 69824 North Sulawesi 680 66 74625 Central Sulawesi 725 180 90526 South Sulawesi 100 100 2,009 707 150 120 57 65 60 70 100 80 3,61827 Southeast Sulawesi 702 80 56 83828 Gorontalo 029 West Sulawesi 030 Maluku 80 8031 North Maluku 032 West Papua 033 Papua 84 100 60 244Total1,425 400 30,795 13,816 3,320 1,545 2,740 1,020 605 1,140 100 120 800 200 1,545 650 720 1,285 480 160 60 62,926TechnicianAKUPUNTUAKFIS ATW SMAK ATG AAK ATRO ARORAPIKESATEMPTTDKARDIOVASKULERTotal
Annex 5.22RECAPITULATION OF HEALTH MANPOWER BY PROVINCEIN DECEMBER <strong>2010</strong>NoProvincesMedicalSpecialist Physician Dentist NurseDentalNurseMidwifePharm.Graduated &PharmacistPharmacistAssistatPublic<strong>Health</strong>GraduatedNutritionistSanitarian(1) (2) (3) (4) (5) (6) (7) (8) (9) (10) (11) (12) (13) (14) (15) (16) (17) (19) (20)1 Aceh 242 841 161 6,888 495 6,516 133 600 1,290 697 480 171 378 291 19,183 2,592 21,7752 North Sumatera 400 1,791 702 8,241 532 9,828 238 841 1,055 581 773 78 335 458 25,853 1,470 27,3233 West Sumatera 290 738 286 3,925 323 3,430 146 536 740 336 373 70 274 222 11,689 1,750 13,4394 Riau 160 779 284 4,360 257 2,818 134 336 413 208 224 43 249 86 10,351 1,836 12,1875 Jambi 161 433 102 3,109 295 1,906 127 360 531 435 165 38 126 233 8,021 1,666 9,6876 South Sumatera 60 505 93 3,129 312 3,409 99 281 1,010 504 320 69 156 96 10,043 1,655 11,6987 Bengkulu 49 377 83 2,816 132 1,950 282 270 818 726 250 52 119 96 8,020 1,560 9,5808 Lampung 130 596 171 3,342 225 2,614 112 174 516 367 196 41 87 142 8,713 1,703 10,4169 Bangka Belitung Island 16 189 46 1,320 91 519 36 101 235 96 102 17 68 53 2,889 467 3,35610 Riau Island 61 339 97 1,673 60 908 77 127 221 125 94 16 90 45 3,933 784 4,71711 DKI Jakarta 2,605 3,302 1,187 24,958 286 1,897 1,886 1,052 3,611 168 1,072 749 2,651 106 45,530 29,955 75,48512 West Java 902 2,385 1,033 14,794 1,110 9,322 273 1,070 1,214 1,140 1,028 97 586 534 35,488 10,121 45,60913 Central Java 1,053 2,716 859 14,605 1,325 11,962 377 1,320 1,323 1,104 1,122 336 1,029 883 40,014 14,165 54,17914 DI Yogyakarta 47 378 199 1,318 255 822 49 174 215 180 164 16 184 143 4,144 1,650 5,79415 East Java 693 2,377 1,124 13,713 819 11,253 306 1,269 834 1,194 1,190 167 555 811 36,305 13,994 50,29916 Banten 102 537 235 2,462 166 2,253 77 106 284 151 174 30 87 52 6,716 1,575 8,29117 Bali 343 937 312 2,745 304 1,853 63 222 309 411 281 69 169 122 8,140 4,042 12,18218 West Nusa Tenggara 69 381 100 3,129 191 2,667 109 164 431 467 669 29 146 91 8,643 2,227 10,87019 East Nusa Tenggara 25 444 131 3,936 414 2,663 116 415 402 576 323 51 144 185 9,825 1,787 11,61220 West Kalimantan 102 468 127 3,916 365 1,825 97 215 321 374 384 33 283 225 8,735 2,282 11,01721 Central Kalimantan 34 385 83 3,067 133 1,266 219 187 296 203 225 16 87 55 6,256 932 7,18822 South Kalimantan 134 539 151 3,385 171 2,097 108 421 592 213 380 23 326 100 8,640 2,169 10,80923 East Kalimantan 206 729 254 4,092 137 1,349 123 242 335 240 210 48 139 150 8,254 2,124 10,37824 North Sulawesi 44 516 45 2,949 259 1,223 90 195 293 401 332 70 8 3 6,428 724 7,15225 Central Sulawesi 88 363 92 3,029 111 1,721 163 200 730 576 190 29 124 54 7,470 1,205 8,67526 South Sulawesi 64 471 322 3,449 420 1,998 194 224 684 417 383 92 105 87 8,910 931 9,84127 Southeast Sulawesi 57 354 88 3,244 138 1,377 168 194 911 544 556 40 175 47 7,893 908 8,80129 Gorontalo 39 191 24 1,249 78 556 103 51 358 293 239 14 19 10 3,224 439 3,66328 West Sulawesi 16 168 71 1,167 45 504 51 59 159 67 61 20 30 27 2,445 220 2,66530 Maluku 36 271 73 2,407 135 1,006 58 41 163 213 258 10 25 14 4,710 705 5,41531 North Maluku 37 199 60 1,757 26 816 109 76 414 83 183 21 64 31 3,876 236 4,11232 West Papua 61 165 37 1,717 35 719 44 94 131 158 137 7 28 27 3,360 200 3,56033 Papua 77 469 99 4,183 78 1,504 97 141 525 257 285 25 253 51 8,044 1,233 9,277Total8,403 25,333 8,731 160,074 9,723 96,551 6,264 11,758 21,364 13,505 12,823 2,587 9,099 5,530 391,745 109,307 501,052Total Per Category 42,467 266,348 18,02234,869 12,823 2,587 9,099 5,530 391,745 109,307 501,052Source: National Board of <strong>Health</strong> Human Resources Development & Empowerment, MoH RINurseryPharmacyPublic <strong>Health</strong>PhysicalTherapyMedicalTechnician<strong>Health</strong>AnalystTotal of<strong>Health</strong>PersonnelTotal ofNon <strong>Health</strong>PersonnelTotal
- Page 2 and 3:
351.770212IndIINDONESIA HEALTH PROF
- Page 4 and 5:
EDITOR OF BOARDAdvisordr. Ratna Ros
- Page 6 and 7:
This Indonesia Health Profile is pr
- Page 8 and 9:
FOREWORDACKNOWLEDGEMENT OF GENERAL
- Page 10 and 11:
Annex 2.1 Distribution of Governmen
- Page 12 and 13:
Annex 3.17 TB Period Prevalence (D)
- Page 14 and 15:
Annex 4.23 Percentage of Population
- Page 16 and 17:
Annex 5.21 Recapitulation of Gradua
- Page 19 and 20:
Ministry of Health's vision is "Hea
- Page 21:
population, birth rate, mortality r
- Page 24 and 25:
Population growth is the change in
- Page 26 and 27:
Age structure of population by sex
- Page 28 and 29:
km2. Provinces with the highest lev
- Page 30 and 31:
GRAPH 2.7DEPENDENCY RATIO BY PROVIN
- Page 32 and 33:
GRAPH 2.8PERCENTAGE OF UNEMPLOYMENT
- Page 34 and 35:
TABLE 2.3NUMBER OF UNDERDEVELOPED D
- Page 36 and 37:
Based on data of number of poor peo
- Page 38 and 39:
GRAPH 2.12PERCENTAGE OF HOUSEHOLD B
- Page 40 and 41:
GRAPH 2.14PERCENTAGE OF HOUSEHOLD B
- Page 42 and 43:
GRAPH 2.16PERCENTAGE OF PEOPLE AGE
- Page 44 and 45:
GRAPH 2.18PERCENTAGE OF WOMEN AGE 1
- Page 47 and 48:
There are several indicators used o
- Page 49 and 50:
2. Underfive Mortality Rate (UMR)Un
- Page 51 and 52:
4. Crude Death RateCrude Death Rate
- Page 53 and 54:
No1234TABEL 3.110 MAIN DISEASES ON
- Page 55 and 56:
Chronic nutrition problem indicated
- Page 57 and 58:
Educationlevel ofparentsTABLE 3.5PR
- Page 59 and 60:
DG of Diasease Control and Environm
- Page 61 and 62:
GRAPH 3.10CASE DETECTION RATE (CDR)
- Page 63 and 64:
c. HIV/AIDSHIV/AIDS is one of commu
- Page 65 and 66:
GRAPH 3.15PERCENTAGE OF AIDS CUMULA
- Page 67 and 68:
GRAPH 3.18NUMBER OF PAUCI BACILLARY
- Page 69 and 70:
GRAPH 3.21PREVALENCE OF YAWS IN IND
- Page 71 and 72:
GRAPH 3.23NUMBER OF DIPTHERIA CASES
- Page 73 and 74:
GRAPH 3.25INCIDENCE RATE OF DHF PER
- Page 75 and 76:
GRAPH 3.29CASE FATALITY RATE (CFR)
- Page 77 and 78:
Above graph shows rising trend of G
- Page 79 and 80:
g. LeptospirosisLeptospirosis is tr
- Page 81:
There were three provinces with hig
- Page 84 and 85:
Survey (SDKI) 2007 recorded MMR 228
- Page 86 and 87:
Graph 4.2 presents achievement of K
- Page 88 and 89:
. Delivery Attendance by Midwifery
- Page 90 and 91:
access of delivery mother to health
- Page 92 and 93:
GRAPH 4.9COVERAGE OF POSTPARTUM CAR
- Page 94 and 95:
Polindes (village maternal clinic),
- Page 96 and 97:
GRAPH 4.14COVERAGE OF COMPLETE NEON
- Page 98 and 99:
g. Underfive Health CareUnderfive h
- Page 100 and 101:
GRAPH 4.19COVERAGE OF PRIMARY SCHOO
- Page 102 and 103:
By sex, method of contraceptive use
- Page 104 and 105:
Of 33 provinces in Indonesia, 20 pr
- Page 106 and 107:
Drop out rate of DPT‐Hb1‐measle
- Page 108 and 109:
Annex 4.43 and Annex 4.44 show drug
- Page 110 and 111:
Other indicator of hospital service
- Page 112 and 113:
In 2010, there were 36.23 million v
- Page 114 and 115:
temperature must be between 0‐8º
- Page 116 and 117:
has increased significantly from 20
- Page 118 and 119:
106Average coverage of pneumonia ca
- Page 120 and 121:
Batam and Mataram. In 2010, it was
- Page 122 and 123:
110Second‐level physical defect c
- Page 124 and 125:
districts/municipalities (25%) of f
- Page 126 and 127:
Monitoring of malaria vector suscep
- Page 128 and 129:
1. Iron (Fe) Tablet Supplementation
- Page 130 and 131:
GRAPH 4.51PERCENTAGE OF WOMEN SWALL
- Page 132 and 133:
GRAPH 4.53PERCENTAGE OF UNDERFIVE G
- Page 134 and 135:
122were West Nusa Tenggara, Bengkul
- Page 136 and 137:
encouraging mother to breastfeed ba
- Page 138:
people by type of disaster and vict
- Page 141 and 142:
GRAPH 5.1RATIO OF HEALTH CENTER PER
- Page 143 and 144:
Table 5.1 below shows the developme
- Page 145 and 146:
GRAPH 5.6NUMBER OF SPECIALTY HOSPIT
- Page 147 and 148:
Proportion of beds in general hospi
- Page 149 and 150:
While distribution facilities of ph
- Page 151 and 152:
GRAPH 5.14RATIO OF POSKESDES TO VIL
- Page 153 and 154:
Graph 5.17 shows number of majors/s
- Page 155 and 156:
Number of Diknakes institutions of
- Page 157 and 158:
Health human resources data had alr
- Page 159 and 160:
In 2010 there were 120 specialist d
- Page 161 and 162:
physicians and 112 dentists. Graph
- Page 163 and 164:
anging from 6 to 14 lecturers. Whil
- Page 165:
Participants of National Community
- Page 168 and 169:
GRAPH 6.1POPULATION IN ASEAN & SEAR
- Page 170 and 171:
In SEARO region, Timor Leste had th
- Page 172 and 173:
By those key indicators, in 2010, t
- Page 174 and 175:
GRAPH 6.8GROSS NATIONAL INCOME (GNI
- Page 176 and 177:
Data in “World Health Statistics
- Page 178 and 179:
Indonesia was on the 2 nd lowest po
- Page 180 and 181:
Avian Influenza firstly entered ASE
- Page 182 and 183:
Indonesia, which in 2005 got the ou
- Page 184 and 185:
GRAPH 6.17COVERAGE OF VACCINATIONIN
- Page 186 and 187:
3. Improved DrinkingWater Source
- Page 188 and 189:
BPS Statistics Indonesia. 2006. Est
- Page 190:
___________. 2005. Publikasi Hasil
- Page 193 and 194:
Annex 2.2TOTAL POPULATION BY SEX AN
- Page 195 and 196:
Annex 2.4POPULATION GROWTH RATEBY P
- Page 197 and 198:
Annex 2.6NUMBER OF POPULATION BY SE
- Page 199 and 200:
Annex 2.838 DISTRICTS AS PRIORITY A
- Page 201 and 202:
Annex 2.10NUMBER AND PERCENTAGE OF
- Page 203 and 204:
Annex 2.12PERCENTAGE OF HOUSEHOLDS
- Page 205 and 206:
Annex 2.14PERCENTAGE OF HOUSEHOLDS
- Page 207 and 208:
Annex 2.16PERCENTAGE OF HOUSEHOLDS
- Page 209 and 210:
Annex 2.18PERCENTAGE OF HOUSEHOLDS
- Page 211 and 212:
Annex 2.20PERCENTAGE OF HOUSEHOLDS
- Page 213 and 214:
Annex 2.22PERCENTAGE OF HOUSEHOLDS
- Page 215 and 216:
Annex 2.24PREVALENCE OF SMOKERS 15
- Page 217 and 218:
Annex 2.26PERCENTAGE OF WOMEN AGED
- Page 219 and 220:
Annex 3.1ESTIMATION OF INFANT MORTA
- Page 221 and 222:
Annex 3.310 MAIN DISEASES OF HOSPIT
- Page 223 and 224:
Annex 3.5PREVALENCE OF UNDERFIVE NU
- Page 225 and 226:
Annex 3.7PREVALENCE OF UNDERFIVE NU
- Page 227 and 228:
Annex 3.9PREVALENCE OF ADULT NUTRIT
- Page 229 and 230:
Annex 3.11ANNUAL PARASITE INSIDENCE
- Page 231 and 232:
Annex 3.13Detection CoverageNo Prov
- Page 233 and 234:
Annex 3.15NoProvinces(1) (2) (3) (4
- Page 235 and 236:
Annex 3.17TB PERIOD PREVALENCE (D)
- Page 237 and 238:
Annex 3.19NoProvincesAIDS CUMULATIV
- Page 239 and 240:
Annex 3.21NUMBER OF UNDERFIVE PNEUM
- Page 241 and 242:
Annex 3.23NUMBER OF TETANUS NEONATO
- Page 243 and 244:
Annex 3.25NUMBER OF MEASLES CASESBY
- Page 245 and 246:
Annex 3.27OUTBREAK FREQUENCY AND NU
- Page 247 and 248:
Annex 3.29NUMBER OF DIPHTERIA CASES
- Page 249 and 250:
Annex 3.31NUMBER OF AFP CASES AND N
- Page 251 and 252:
Annex 3.33NUMBER OF DISTRICTS/MUNIC
- Page 253 and 254:
Annex 3.35NUMBER OF CHIKUNGUNYA CAS
- Page 255 and 256:
Annex 3.37NUMBER OF FILARIASIS CASE
- Page 257 and 258:
Annex 3.39NUMBER OF LEPTOSPYROSIS C
- Page 259 and 260:
Annex 3.41NUMBER OF AVIAN INFLUENZA
- Page 261 and 262:
Annex 4.2PERCENTAGE OF WOMEN AGE 10
- Page 263 and 264:
Annex 4.4PERCENTAGE OF WOMEN AGE 10
- Page 265 and 266:
Annex 4.6PERCENTAGE OF NEW FAMILY P
- Page 267 and 268:
Annex 4.8PERCENTAGE OF ACTIVE FAMIL
- Page 269 and 270:
Lampiran 4.10NoProvincesCoverage of
- Page 271 and 272:
Annex 4.12PERCENTAGE OF NEONATES VI
- Page 273 and 274: Annex 4.14COVERAGE OF INFANT AND UN
- Page 275 and 276: Annex 4.16COVERAGE OF UNDERFIVE WEI
- Page 277 and 278: Annex 4.18COVERAGE OF EXCLUSIVE BRE
- Page 279 and 280: Annex 4.20TargetVitamin A CoverageN
- Page 281 and 282: Annex 4.22PERCENTAGE OF CHILDREN AG
- Page 283 and 284: Annex 4.24COVERAGE OF UNIVERSAL CHI
- Page 285 and 286: Annex 4.26PERCENTAGE OF CHILDREN AG
- Page 287 and 288: Annex 4.28DROP OUT RATE OF IMMUNIZA
- Page 289 and 290: Annex 4.30NoProvincesNumber ofPregn
- Page 291 and 292: Annex 4.32NoProvincesNumber ofFerti
- Page 293 and 294: Annex 4.34PERCENTAGE OF TUBERCULOSI
- Page 295 and 296: Annex 4.36NUMBER OF INPATIENT VISIT
- Page 297 and 298: Annex 4.38EXAMINATION OF DENTAL AND
- Page 299 and 300: Annex 4.43PERCENTAGE OF DRUG AND VA
- Page 301 and 302: Annex 4.41NUMBER OF ADVANCE LEVEL I
- Page 303 and 304: Annex 4.44PERCENTAGE OF DRUG AND VA
- Page 305 and 306: Annex 5.2NoProvincesNumber of Healt
- Page 307 and 308: Annex 5.4NUMBER OF HOSPITAL AND BED
- Page 309 and 310: Annex 5.6NUMBER OF SPECIFIC HOSPITA
- Page 311 and 312: Annex 5.8NUMBER OF PRODUCTION FACIL
- Page 313 and 314: Annex 5.10NUMBER OF HEALTH EFFORT C
- Page 315 and 316: Annex 5.12NUMBER OF NON HEALTH POLY
- Page 317 and 318: Annex 5.14NUMBER OF NON POLYTECHNIC
- Page 319 and 320: Annex 5.16RECAPITULATION OF POLTEKK
- Page 321 and 322: Annex 5.18RECAPITULATION OF STUDENT
- Page 323: Annex 5.20NUMBER OF POLTEKKES GRADU
- Page 327 and 328: Annex 5.24RATIO OF PHYSICIAN, DENTI
- Page 329 and 330: Annex 5.26RECAPITULATION OF PHYSICI
- Page 331 and 332: Annex 5.28RECAPITULATION OF MIDWIFE
- Page 333 and 334: Annex 5.30RECAPITULATION OF DENTIST
- Page 335 and 336: Annex 5.33RECAPITULATION OF PHYSICI
- Page 337 and 338: Annex 5.34RECAPITULATION OF DENTIST
- Page 339 and 340: Annex 5.36DISTRIBUTION OF WIDYAISWA
- Page 341 and 342: Annex 5.38ALLOCATION AND REALIZATIO
- Page 343 and 344: Annex 5.40DISTRIBUTION OF MOH EMPLO
- Page 345 and 346: Annex 6.2BIRTH RATE, MORTALITY RATE
- Page 347 and 348: Annex 6.4TUBERCULOSIS IN ASEAN AND
- Page 349 and 350: Annex 6.6NUMBER OF VACCINE-PREVENTA
- Page 351 and 352: Annex 6.8HEALTH EFFORTS IN ASEAN AN