- Page 2 and 3:
351.770212IndIINDONESIA HEALTH PROF
- Page 4 and 5:
EDITOR OF BOARDAdvisordr. Ratna Ros
- Page 6 and 7:
This Indonesia Health Profile is pr
- Page 8 and 9: FOREWORDACKNOWLEDGEMENT OF GENERAL
- Page 10 and 11: Annex 2.1 Distribution of Governmen
- Page 12 and 13: Annex 3.17 TB Period Prevalence (D)
- Page 14 and 15: Annex 4.23 Percentage of Population
- Page 16 and 17: Annex 5.21 Recapitulation of Gradua
- Page 19 and 20: Ministry of Health's vision is "Hea
- Page 21: population, birth rate, mortality r
- Page 24 and 25: Population growth is the change in
- Page 26 and 27: Age structure of population by sex
- Page 28 and 29: km2. Provinces with the highest lev
- Page 30 and 31: GRAPH 2.7DEPENDENCY RATIO BY PROVIN
- Page 32 and 33: GRAPH 2.8PERCENTAGE OF UNEMPLOYMENT
- Page 34 and 35: TABLE 2.3NUMBER OF UNDERDEVELOPED D
- Page 36 and 37: Based on data of number of poor peo
- Page 38 and 39: GRAPH 2.12PERCENTAGE OF HOUSEHOLD B
- Page 40 and 41: GRAPH 2.14PERCENTAGE OF HOUSEHOLD B
- Page 42 and 43: GRAPH 2.16PERCENTAGE OF PEOPLE AGE
- Page 44 and 45: GRAPH 2.18PERCENTAGE OF WOMEN AGE 1
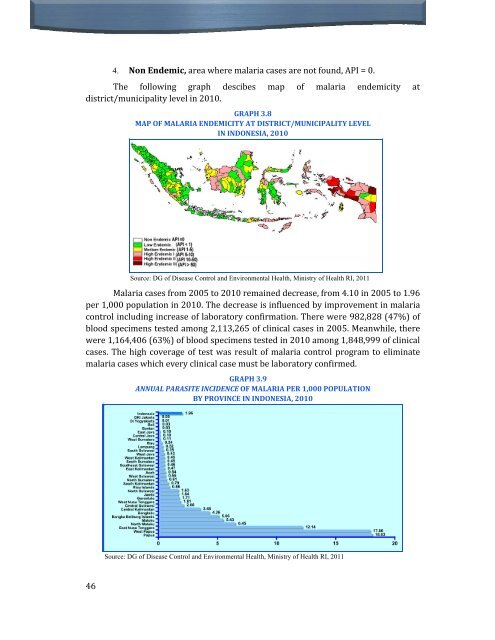
- Page 47 and 48: There are several indicators used o
- Page 49 and 50: 2. Underfive Mortality Rate (UMR)Un
- Page 51 and 52: 4. Crude Death RateCrude Death Rate
- Page 53 and 54: No1234TABEL 3.110 MAIN DISEASES ON
- Page 55 and 56: Chronic nutrition problem indicated
- Page 57: Educationlevel ofparentsTABLE 3.5PR
- Page 61 and 62: GRAPH 3.10CASE DETECTION RATE (CDR)
- Page 63 and 64: c. HIV/AIDSHIV/AIDS is one of commu
- Page 65 and 66: GRAPH 3.15PERCENTAGE OF AIDS CUMULA
- Page 67 and 68: GRAPH 3.18NUMBER OF PAUCI BACILLARY
- Page 69 and 70: GRAPH 3.21PREVALENCE OF YAWS IN IND
- Page 71 and 72: GRAPH 3.23NUMBER OF DIPTHERIA CASES
- Page 73 and 74: GRAPH 3.25INCIDENCE RATE OF DHF PER
- Page 75 and 76: GRAPH 3.29CASE FATALITY RATE (CFR)
- Page 77 and 78: Above graph shows rising trend of G
- Page 79 and 80: g. LeptospirosisLeptospirosis is tr
- Page 81: There were three provinces with hig
- Page 84 and 85: Survey (SDKI) 2007 recorded MMR 228
- Page 86 and 87: Graph 4.2 presents achievement of K
- Page 88 and 89: . Delivery Attendance by Midwifery
- Page 90 and 91: access of delivery mother to health
- Page 92 and 93: GRAPH 4.9COVERAGE OF POSTPARTUM CAR
- Page 94 and 95: Polindes (village maternal clinic),
- Page 96 and 97: GRAPH 4.14COVERAGE OF COMPLETE NEON
- Page 98 and 99: g. Underfive Health CareUnderfive h
- Page 100 and 101: GRAPH 4.19COVERAGE OF PRIMARY SCHOO
- Page 102 and 103: By sex, method of contraceptive use
- Page 104 and 105: Of 33 provinces in Indonesia, 20 pr
- Page 106 and 107: Drop out rate of DPT‐Hb1‐measle
- Page 108 and 109:
Annex 4.43 and Annex 4.44 show drug
- Page 110 and 111:
Other indicator of hospital service
- Page 112 and 113:
In 2010, there were 36.23 million v
- Page 114 and 115:
temperature must be between 0‐8º
- Page 116 and 117:
has increased significantly from 20
- Page 118 and 119:
106Average coverage of pneumonia ca
- Page 120 and 121:
Batam and Mataram. In 2010, it was
- Page 122 and 123:
110Second‐level physical defect c
- Page 124 and 125:
districts/municipalities (25%) of f
- Page 126 and 127:
Monitoring of malaria vector suscep
- Page 128 and 129:
1. Iron (Fe) Tablet Supplementation
- Page 130 and 131:
GRAPH 4.51PERCENTAGE OF WOMEN SWALL
- Page 132 and 133:
GRAPH 4.53PERCENTAGE OF UNDERFIVE G
- Page 134 and 135:
122were West Nusa Tenggara, Bengkul
- Page 136 and 137:
encouraging mother to breastfeed ba
- Page 138:
people by type of disaster and vict
- Page 141 and 142:
GRAPH 5.1RATIO OF HEALTH CENTER PER
- Page 143 and 144:
Table 5.1 below shows the developme
- Page 145 and 146:
GRAPH 5.6NUMBER OF SPECIALTY HOSPIT
- Page 147 and 148:
Proportion of beds in general hospi
- Page 149 and 150:
While distribution facilities of ph
- Page 151 and 152:
GRAPH 5.14RATIO OF POSKESDES TO VIL
- Page 153 and 154:
Graph 5.17 shows number of majors/s
- Page 155 and 156:
Number of Diknakes institutions of
- Page 157 and 158:
Health human resources data had alr
- Page 159 and 160:
In 2010 there were 120 specialist d
- Page 161 and 162:
physicians and 112 dentists. Graph
- Page 163 and 164:
anging from 6 to 14 lecturers. Whil
- Page 165:
Participants of National Community
- Page 168 and 169:
GRAPH 6.1POPULATION IN ASEAN & SEAR
- Page 170 and 171:
In SEARO region, Timor Leste had th
- Page 172 and 173:
By those key indicators, in 2010, t
- Page 174 and 175:
GRAPH 6.8GROSS NATIONAL INCOME (GNI
- Page 176 and 177:
Data in “World Health Statistics
- Page 178 and 179:
Indonesia was on the 2 nd lowest po
- Page 180 and 181:
Avian Influenza firstly entered ASE
- Page 182 and 183:
Indonesia, which in 2005 got the ou
- Page 184 and 185:
GRAPH 6.17COVERAGE OF VACCINATIONIN
- Page 186 and 187:
3. Improved DrinkingWater Source
- Page 188 and 189:
BPS Statistics Indonesia. 2006. Est
- Page 190:
___________. 2005. Publikasi Hasil
- Page 193 and 194:
Annex 2.2TOTAL POPULATION BY SEX AN
- Page 195 and 196:
Annex 2.4POPULATION GROWTH RATEBY P
- Page 197 and 198:
Annex 2.6NUMBER OF POPULATION BY SE
- Page 199 and 200:
Annex 2.838 DISTRICTS AS PRIORITY A
- Page 201 and 202:
Annex 2.10NUMBER AND PERCENTAGE OF
- Page 203 and 204:
Annex 2.12PERCENTAGE OF HOUSEHOLDS
- Page 205 and 206:
Annex 2.14PERCENTAGE OF HOUSEHOLDS
- Page 207 and 208:
Annex 2.16PERCENTAGE OF HOUSEHOLDS
- Page 209 and 210:
Annex 2.18PERCENTAGE OF HOUSEHOLDS
- Page 211 and 212:
Annex 2.20PERCENTAGE OF HOUSEHOLDS
- Page 213 and 214:
Annex 2.22PERCENTAGE OF HOUSEHOLDS
- Page 215 and 216:
Annex 2.24PREVALENCE OF SMOKERS 15
- Page 217 and 218:
Annex 2.26PERCENTAGE OF WOMEN AGED
- Page 219 and 220:
Annex 3.1ESTIMATION OF INFANT MORTA
- Page 221 and 222:
Annex 3.310 MAIN DISEASES OF HOSPIT
- Page 223 and 224:
Annex 3.5PREVALENCE OF UNDERFIVE NU
- Page 225 and 226:
Annex 3.7PREVALENCE OF UNDERFIVE NU
- Page 227 and 228:
Annex 3.9PREVALENCE OF ADULT NUTRIT
- Page 229 and 230:
Annex 3.11ANNUAL PARASITE INSIDENCE
- Page 231 and 232:
Annex 3.13Detection CoverageNo Prov
- Page 233 and 234:
Annex 3.15NoProvinces(1) (2) (3) (4
- Page 235 and 236:
Annex 3.17TB PERIOD PREVALENCE (D)
- Page 237 and 238:
Annex 3.19NoProvincesAIDS CUMULATIV
- Page 239 and 240:
Annex 3.21NUMBER OF UNDERFIVE PNEUM
- Page 241 and 242:
Annex 3.23NUMBER OF TETANUS NEONATO
- Page 243 and 244:
Annex 3.25NUMBER OF MEASLES CASESBY
- Page 245 and 246:
Annex 3.27OUTBREAK FREQUENCY AND NU
- Page 247 and 248:
Annex 3.29NUMBER OF DIPHTERIA CASES
- Page 249 and 250:
Annex 3.31NUMBER OF AFP CASES AND N
- Page 251 and 252:
Annex 3.33NUMBER OF DISTRICTS/MUNIC
- Page 253 and 254:
Annex 3.35NUMBER OF CHIKUNGUNYA CAS
- Page 255 and 256:
Annex 3.37NUMBER OF FILARIASIS CASE
- Page 257 and 258:
Annex 3.39NUMBER OF LEPTOSPYROSIS C
- Page 259 and 260:
Annex 3.41NUMBER OF AVIAN INFLUENZA
- Page 261 and 262:
Annex 4.2PERCENTAGE OF WOMEN AGE 10
- Page 263 and 264:
Annex 4.4PERCENTAGE OF WOMEN AGE 10
- Page 265 and 266:
Annex 4.6PERCENTAGE OF NEW FAMILY P
- Page 267 and 268:
Annex 4.8PERCENTAGE OF ACTIVE FAMIL
- Page 269 and 270:
Lampiran 4.10NoProvincesCoverage of
- Page 271 and 272:
Annex 4.12PERCENTAGE OF NEONATES VI
- Page 273 and 274:
Annex 4.14COVERAGE OF INFANT AND UN
- Page 275 and 276:
Annex 4.16COVERAGE OF UNDERFIVE WEI
- Page 277 and 278:
Annex 4.18COVERAGE OF EXCLUSIVE BRE
- Page 279 and 280:
Annex 4.20TargetVitamin A CoverageN
- Page 281 and 282:
Annex 4.22PERCENTAGE OF CHILDREN AG
- Page 283 and 284:
Annex 4.24COVERAGE OF UNIVERSAL CHI
- Page 285 and 286:
Annex 4.26PERCENTAGE OF CHILDREN AG
- Page 287 and 288:
Annex 4.28DROP OUT RATE OF IMMUNIZA
- Page 289 and 290:
Annex 4.30NoProvincesNumber ofPregn
- Page 291 and 292:
Annex 4.32NoProvincesNumber ofFerti
- Page 293 and 294:
Annex 4.34PERCENTAGE OF TUBERCULOSI
- Page 295 and 296:
Annex 4.36NUMBER OF INPATIENT VISIT
- Page 297 and 298:
Annex 4.38EXAMINATION OF DENTAL AND
- Page 299 and 300:
Annex 4.43PERCENTAGE OF DRUG AND VA
- Page 301 and 302:
Annex 4.41NUMBER OF ADVANCE LEVEL I
- Page 303 and 304:
Annex 4.44PERCENTAGE OF DRUG AND VA
- Page 305 and 306:
Annex 5.2NoProvincesNumber of Healt
- Page 307 and 308:
Annex 5.4NUMBER OF HOSPITAL AND BED
- Page 309 and 310:
Annex 5.6NUMBER OF SPECIFIC HOSPITA
- Page 311 and 312:
Annex 5.8NUMBER OF PRODUCTION FACIL
- Page 313 and 314:
Annex 5.10NUMBER OF HEALTH EFFORT C
- Page 315 and 316:
Annex 5.12NUMBER OF NON HEALTH POLY
- Page 317 and 318:
Annex 5.14NUMBER OF NON POLYTECHNIC
- Page 319 and 320:
Annex 5.16RECAPITULATION OF POLTEKK
- Page 321 and 322:
Annex 5.18RECAPITULATION OF STUDENT
- Page 323 and 324:
Annex 5.20NUMBER OF POLTEKKES GRADU
- Page 325 and 326:
Annex 5.22RECAPITULATION OF HEALTH
- Page 327 and 328:
Annex 5.24RATIO OF PHYSICIAN, DENTI
- Page 329 and 330:
Annex 5.26RECAPITULATION OF PHYSICI
- Page 331 and 332:
Annex 5.28RECAPITULATION OF MIDWIFE
- Page 333 and 334:
Annex 5.30RECAPITULATION OF DENTIST
- Page 335 and 336:
Annex 5.33RECAPITULATION OF PHYSICI
- Page 337 and 338:
Annex 5.34RECAPITULATION OF DENTIST
- Page 339 and 340:
Annex 5.36DISTRIBUTION OF WIDYAISWA
- Page 341 and 342:
Annex 5.38ALLOCATION AND REALIZATIO
- Page 343 and 344:
Annex 5.40DISTRIBUTION OF MOH EMPLO
- Page 345 and 346:
Annex 6.2BIRTH RATE, MORTALITY RATE
- Page 347 and 348:
Annex 6.4TUBERCULOSIS IN ASEAN AND
- Page 349 and 350:
Annex 6.6NUMBER OF VACCINE-PREVENTA
- Page 351 and 352:
Annex 6.8HEALTH EFFORTS IN ASEAN AN