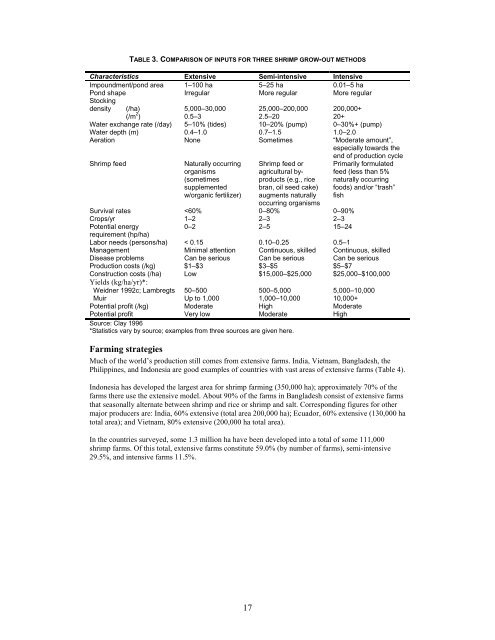
TABLE 3. COMPARISON OF INPUTS FOR THREE SHRIMP GROW-OUT METHODSCharacteristics Extensive Semi-intensive IntensiveImpoundment/pond area 1–100 ha 5–25 ha 0.01–5 haPond shape Irregular More regular More regularStockingdensity (/ha) 5,000–30,000 25,000–200,000 200,000+(/m 2 ) 0.5–3 2.5–20 20+Water exchange rate (/day) 5–10% (tides) 10–20% (pump) 0–30%+ (pump)Water depth (m) 0.4–1.0 0.7–1.5 1.0–2.0Aeration None Sometimes “Moderate amount”,especially towards <strong>the</strong>end of production cycle<strong>Shrimp</strong> feedNaturally occurringorganisms(sometimessupplementedw/organic fertilizer)<strong>Shrimp</strong> feed oragricultural byproducts(e.g., ricebran, oil seed cake)augments naturallyoccurring organismsPrimarily formulatedfeed (less than 5%naturally occurringfoods) <strong>and</strong>/or “trash”fishSurvival rates
TABLE 4. OVERVIEW OF SHRIMP FARMING IN MAJOR PRODUCING NATIONS: 1996Country No. of Total area Production Extensive SemiintensiveIntensivefarms (ha) (head-on, MT)Belize 6 600 2,000 0% 90% 10%Costa Rica 4 800 1,000 0% 100% 0%Ecuador 1,200 130,000 120,000 60% 40% 0%Honduras 55 12,000 10,000 5% 95% 0%Mexico 240 14,000 12,000 25% 65% 10%Nicaragua 20 4,000 3,000 0% 100% 0%Peru 40 3,000 5,000 5% 90% 5%USA 30 700 1,300 0% 80% 20%Venezuela 7 800 2,000 0% 100% 0%Australia 33 400 1,700 0% 20% 80%Bangladesh 13,000 140,000 35,000 90% 10% 0%China 6,000 120,000 80,000 10% 85% 5%India 10,000 200,000 70,000 60% 35% 5%Indonesia 60,000 350,000 90,000 70% 15% 15%Malaysia 400 4,000 4,000 40% 50% 10%Philippines 1,000 60,000 4,000 40% 40% 20%Sri Lanka 900 2,500 2,000 10% 20% 70%Thail<strong>and</strong> 16,000 70,000 160,000 5% 15% 80%Vietnam 2,000 200,000 30,000 80% 15% 5%Total 110,935 1,312,800 633,000Source: Rosenberry 1996. NB: Figures are approximate only <strong>and</strong> do not include all shrimp farming nations.Ecuador is making <strong>the</strong> transition from extensive to semi-intensive farming. Nor<strong>the</strong>rn China pursues itsown model of semi-intensive farming. Japan; Taiwan, Republic of China; <strong>the</strong> U.S.; Australia; Thail<strong>and</strong>;Sri Lanka; <strong>and</strong> some European countries concentrate on intensive shrimp farming, <strong>and</strong> intensive farmsoccur in all major shrimp farming areas of <strong>the</strong> world, but especially in Thail<strong>and</strong>, Sri Lanka, <strong>and</strong>Australia.Scale<strong>Shrimp</strong> farms vary enormously in scale, in terms of both area used <strong>and</strong> production. Small farms inSou<strong>the</strong>ast Asia may be half a hectare or less, while semi-intensive farms in South <strong>and</strong> Central Americamay cover thous<strong>and</strong>s of hectares. Small-scale operations are characterized by low investments <strong>and</strong> aninterplay with o<strong>the</strong>r operators, often more sophisticated <strong>and</strong> larger-scale, in <strong>the</strong>ir vicinity.Small farms are often thought to have limited impact on <strong>the</strong> environment. This is misleading; <strong>the</strong>cumulative impact of a large number of contiguous small farms (or those in close proximity) can be asenvironmentally damaging, or more so, than single large-scale developments. It is <strong>the</strong>refore importantto take into account <strong>the</strong> density of development, especially in relation to carrying capacity, whenconsidering <strong>the</strong> environmental impact of aquaculture.The procurement of post-larvae (PL) for larger operations is often undertaken by small-scale operators,sometimes from <strong>the</strong> wild-capture fishery. The danger involved in such operations is that <strong>the</strong> small-scaleoperator often lacks <strong>the</strong> ability to take on responsibility for this ecosystem because of a poor economicsituation <strong>and</strong> lack of training. Small operators <strong>the</strong>refore tend to focus on short-term survival of <strong>the</strong>irown operations at <strong>the</strong> expense of <strong>the</strong> environment, even when <strong>the</strong>y underst<strong>and</strong> <strong>the</strong> local ecosystems.Thus, such operations tend to be detrimental to <strong>the</strong> environment, <strong>and</strong> particularly to <strong>the</strong> sustainability ofboth shrimp farming <strong>and</strong> capture fisheries.Summary <strong>and</strong> conclusionsA wide range of shrimp farming technologies, production systems, <strong>and</strong> scale of enterprise are foundthroughout <strong>the</strong> world, from highly extensive systems based on passive stocking <strong>and</strong> little if anyfertilizer or feed inputs, to highly intensive systems using high stocking densities, formulated feeds,<strong>and</strong> intensive aeration. They may be located in marine, brackish, <strong>and</strong> even inl<strong>and</strong> waters, but typicallyuse ear<strong>the</strong>n ponds. Although <strong>the</strong> use of hatchery-produced seed is increasingly common, almost allhatcheries still depend on wild broodstock.18
- Page 7 and 8: sensitivity analysis should include
- Page 9 and 10: ABBREVIATIONSMTkgmcmhaozPUDFOBCIFC&
- Page 11 and 12: ORGANIZATION OF THE REPORTIn Chapte
- Page 13 and 14: same time, development is necessary
- Page 15 and 16: Current shrimp farming practice inc
- Page 17 and 18: Current status of the industryToday
- Page 19 and 20: In recent years, several major crop
- Page 21: CHAPTER 2: SHRIMP FARMING SYSTEMSSh
- Page 24 and 25: FeedsHatcheries use a combination o
- Page 26 and 27: FIGURE 8. CONTINUUM OF DIFFERENT SH
- Page 30 and 31: Shrimp farming systems vary greatly
- Page 32 and 33: creeks, and sea-grass beds, fulfill
- Page 34 and 35: arrangement in Thailand, for exampl
- Page 36 and 37: capacity is not exceeded, the nutri
- Page 38 and 39: shrimp or high-value finfish produc
- Page 40 and 41: In more immediately practical terms
- Page 42 and 43: Disease prevention and managementDi
- Page 44 and 45: (Raa 1996) indicates that it is pos
- Page 46 and 47: suitable for human consumption or f
- Page 48 and 49: • Supply and effluent canals shou
- Page 50 and 51: CHAPTER 4: SOCIAL AND ECONOMIC IMPA
- Page 52 and 53: opportunities would need to be iden
- Page 54 and 55: 26 workdays per hectare, and an ext
- Page 56 and 57: One of the key elements for success
- Page 58 and 59: Minimizing negative social repercus
- Page 60 and 61: CHAPTER 5: FINANCIAL RISKS ASSOCIAT
- Page 62 and 63: Credit riskAccess to credit at fair
- Page 64 and 65: Natural factorsShrimp diseaseThe ou
- Page 66 and 67: CHAPTER 6: PLANNING AND MANAGEMENT
- Page 68 and 69: Planning and resource managementIna
- Page 70 and 71: Such initiatives have been or are b
- Page 72 and 73: Conclusions and recommendationsReco
- Page 74 and 75: equired to promote sustainability a
- Page 76 and 77: CHAPTER 7: PROJECT PLANNING AND ASS
- Page 78 and 79:
• Appraisal and supervision missi
- Page 80 and 81:
The structure of the executive summ
- Page 82 and 83:
CHAPTER 8: CONCLUSIONS, RECOMMENDAT
- Page 84 and 85:
• Requirements and guidance for f
- Page 86 and 87:
EmploymentAs mentioned in the repor
- Page 88 and 89:
ANNEX 1: A BLUEPRINT FOR FEASIBILIT
- Page 90 and 91:
• Sensitivity calculations and an
- Page 92 and 93:
Table A4: World shrimp farming prod
- Page 94 and 95:
ANNEX 4: CASE STUDIES UNDERTAKEN BY
- Page 96 and 97:
ColombiaThe Adoption of Good Manage
- Page 98 and 99:
LocationAppendix A--Meetings Held o
- Page 100 and 101:
LocationAppendix A--Meetings Held o
- Page 102 and 103:
LocationAppendix A--Meetings Held o
- Page 104 and 105:
BIBLIOGRAPHYAdger, W.N. 1998. Susta
- Page 106 and 107:
Claridge, G. 1996. Legal approaches
- Page 108 and 109:
Hambrey, J.B., M. Phillips, K. Chow
- Page 110 and 111:
Phillips, M.J., & D.J. Macintosh. 1
- Page 112:
World Commission on Environment and