2012 - Bureau of Police Research and Development
2012 - Bureau of Police Research and Development
2012 - Bureau of Police Research and Development

You also want an ePaper? Increase the reach of your titles
YUMPU automatically turns print PDFs into web optimized ePapers that Google loves.
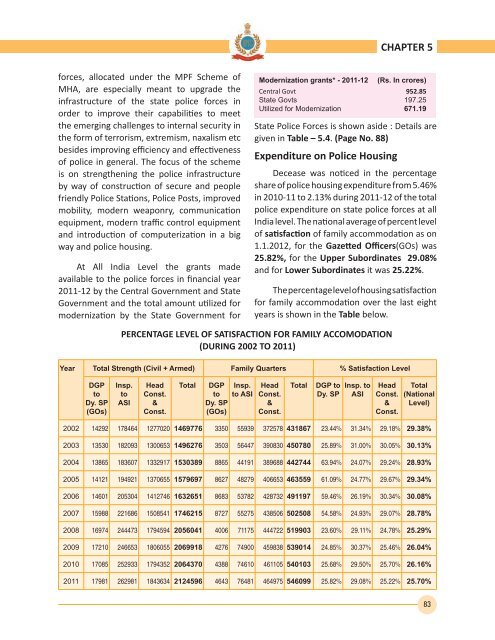
CHAPTER 5forces, allocated under the MPF Scheme <strong>of</strong>MHA, are especially meant to upgrade theinfrastructure <strong>of</strong> the state police forces inorder to improve their capabilities to meetthe emerging challenges to internal security inthe form <strong>of</strong> terrorism, extremism, naxalism etcbesides improving efficiency <strong>and</strong> effectiveness<strong>of</strong> police in general. The focus <strong>of</strong> the schemeis on strengthening the police infrastructureby way <strong>of</strong> construction <strong>of</strong> secure <strong>and</strong> peoplefriendly <strong>Police</strong> Stations, <strong>Police</strong> Posts, improvedmobility, modern weaponry, communicationequipment, modern traffic control equipment<strong>and</strong> introduction <strong>of</strong> computerization in a bigway <strong>and</strong> police housing.At All India Level the grants madeavailable to the police forces in financial year2011-12 by the Central Government <strong>and</strong> StateGovernment <strong>and</strong> the total amount utilized formodernization by the State Government forModernization grants* - 2011-12 (Rs. In crores)Central Govt 952.85State Govts 197.25Utilized for Modernization 671.19State <strong>Police</strong> Forces is shown aside : Details aregiven in Table – 5.4. (Page No. 88)Expenditure on <strong>Police</strong> HousingDecease was noticed in the percentageshare <strong>of</strong> police housing expenditure from 5.46%in 2010-11 to 2.13% during 2011-12 <strong>of</strong> the totalpolice expenditure on state police forces at allIndia level. The national average <strong>of</strong> percent level<strong>of</strong> satisfaction <strong>of</strong> family accommodation as on1.1.<strong>2012</strong>, for the Gazetted Officers(GOs) was25.82%, for the Upper Subordinates 29.08%<strong>and</strong> for Lower Subordinates it was 25.22%.The percentage level <strong>of</strong> housing satisfactionfor family accommodation over the last eightyears is shown in the Table below.PERCENTAGE LEVEL OF SATISFACTION FOR FAMILY ACCOMODATION(DURING 2002 TO 2011)Year Total Strength (Civil + Armed) Family Quarters % Satisfaction LevelDGPtoDy. SP(GOs)Insp.toASIHeadConst.&Const.TotalDGPtoDy. SP(GOs)Insp.to ASIHeadConst.&Const.TotalDGP toDy. SPInsp. toASIHeadConst.&Const.Total(NationalLevel)2002 14292 178464 1277020 1469776 3350 55939 372578 431867 23.44% 31.34% 29.18% 29.38%2003 13530 182093 1300653 1496276 3503 56447 390830 450780 25.89% 31.00% 30.05% 30.13%2004 13865 183607 1332917 1530389 8865 44191 389688 442744 63.94% 24.07% 29.24% 28.93%2005 14121 194921 1370655 1579697 8627 48279 406653 463559 61.09% 24.77% 29.67% 29.34%2006 14601 205304 1412746 1632651 8683 53782 428732 491197 59.46% 26.19% 30.34% 30.08%2007 15988 221686 1508541 1746215 8727 55275 438506 502508 54.58% 24.93% 29.07% 28.78%2008 16974 244473 1794594 2056041 4006 71175 444722 519903 23.60% 29.11% 24.78% 25.29%2009 17210 246653 1806055 2069918 4276 74900 459838 539014 24.85% 30.37% 25.46% 26.04%2010 17085 252933 1794352 2064370 4388 74610 461105 540103 25.68% 29.50% 25.70% 26.16%2011 17981 262981 1843634 2124596 4643 76481 464975 546099 25.82% 29.08% 25.22% 25.70%83