CHAPTER 11TABLE 11.5 -- STATE/UT-WISE DISPOSAL OF CASES UNDER SPECIAL AND LOCAL LAWS (SLL) BYCOURTS DURING 2011Sl.No. States / UTs.TotalNo.<strong>of</strong>casesfor trialincludingpendingcasesfrompreviousyearCompoundedorWithdrawnNo. <strong>of</strong> CasesIn Which Trials were completedConvicted AcquittedorDischargedTotal {(6)+(7)}PendingTrial at theend <strong>of</strong> theyearCaseswithdrawnbyGovernmentPendency% age% age <strong>of</strong>Pendencyto allIndiaTotalConvictionRate {(6)/(8)}*100(1) (2) (3) (4) (5) (6) (7) (8) (9) (10) (11) (12)1 Andhra Pradesh++ 299,745 1 599 240,803 25,084 265,887 33,259 11.1 0.7 90.62 Arunachal Pradesh 779 0 0 5 4 9 770 98.8 0.0 55.63 Assam 9,106 0 18 75 773 848 8,240 90.5 0.2 8.84 Bihar 59,595 0 310 1,728 4,406 6,134 53,151 89.2 1.1 28.25 Chhattisgrh 307,189 0 52,333 199,383 5,486 204,869 49,987 16.3 1.0 97.36 Goa 7,725 0 1 2,094 598 2,692 5,032 65.1 0.1 77.87 Gujarat 1,570,101 0 823 115,420 49,398 164,818 1,404,460 89.5 28.6 70.08 Haryana 100,040 0 2 20,980 11,045 32,025 68,013 68.0 1.4 65.59 Himachal Pradesh 23,893 0 45 1,422 2,021 3,443 20,405 85.4 0.4 41.310 Jammu & Kashmir 17,998 0 11 621 916 1,537 16,450 91.4 0.3 40.411 Jharkh<strong>and</strong> 10,991 0 33 1,148 1,712 2,860 8,098 73.7 0.2 40.112 Karnataka 50,558 63 128 7,118 6,473 13,591 36,839 72.9 0.8 52.413 Kerala 503,061 20 1,848 140,128 13,576 153,704 347,509 69.1 7.1 91.214 Madhya Pradesh 194,341 410 258 113,084 10,402 123,486 70,597 36.3 1.4 91.615 Maharashtra 1,287,632 47 15,773 20,396 93,862 114,258 1,157,601 89.9 23.6 17.916 Manipur 2,081 0 1 33 27 60 2,020 97.1 0.0 55.017 Meghalaya 1,049 0 0 47 37 84 965 92.0 0.0 56.018 Mizoram 1,150 0 0 345 18 363 787 68.4 0.0 95.019 Nagal<strong>and</strong> 1,180 0 0 774 39 813 367 31.1 0.0 95.220 Orissa 78,944 0 0 963 7,343 8,306 70,638 89.5 1.4 11.621 Punjab 72,876 18 49 13,768 4,013 17,781 55,046 75.5 1.1 77.422 Rajasthan 159,231 0 239 44,441 3,002 47,443 111,549 70.1 2.3 93.723 Sikkim 298 0 0 201 9 210 88 29.5 0.0 95.724 Tamil Nadu 343,528 115 5 228,808 26,041 254,849 88,674 25.8 1.8 89.825 Tripura 662 0 0 40 69 109 553 83.5 0.0 36.726 Uttar Pradesh 3,028,892 8 7 1,902,152 60,919 1,963,071 1,065,814 32.2 21.7 96.927 Uttarakh<strong>and</strong> 117,853 0 0 87,783 513 88,296 29,557 25.1 0.6 99.428 West Bengal 58,427 0 42 832 2109 2,941 55,444 94.9 1.1 28.329 A&N Isl<strong>and</strong>s 32,693 0 0 11,456 0 11,456 21,237 65.0 0.4 100.030 Ch<strong>and</strong>igarh 1685 0 0 540 80 620 1,065 63.2 0.0 87.131 D&N Haveli 152 0 0 2 0 2 150 98.7 0.0 100.032 Daman & Diu 44 0 0 0 9 9 35 79.5 0.0 0.033 Delhi 127,218 0 0 6,465 3,266 9,731 117,487 92.4 2.4 66.434 Lakshadweep 43 0 0 7 2 9 34 79.1 0.0 -35 Puducherry 2,162 0 0 1,026 115 1,141 1,021 47.2 0.0 89.9All India 8,472,922 682 72,525 3,164,088 333,367 3,497,455 4,902,942 57.9 100.0 90.5Note: 1. There may be variation in pending brought forward cases against most <strong>of</strong> the crime heads particularydue to revision <strong>of</strong> such datasent incorrect by Punjab, Gujarat, Karnatka, Nagal<strong>and</strong>, Lakshadweep, D&NHavelistate as clarified by them.2. J&K variation in pending investigation/trial cases is due to reopening <strong>of</strong> cases as clarified by them.3. In AP variation (-) is due to less registartion M.V. Act <strong>of</strong> Town Nuisance Act.Source: Crime in India - 2011: NCRB Publication, Table No. 4.10129
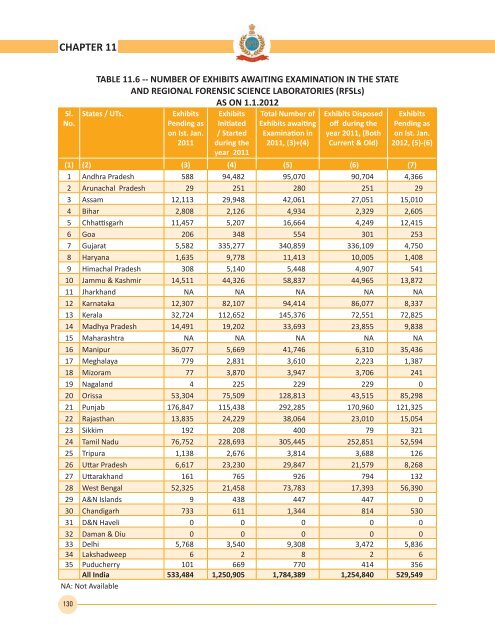
CHAPTER 11Sl.No.130TABLE 11.6 -- NUMBER OF EXHIBITS AWAITING EXAMINATION IN THE STATEAND REGIONAL FORENSIC SCIENCE LABORATORIES (RFSLs)AS ON 1.1.<strong>2012</strong>States / UTs.ExhibitsPending ason Ist. Jan.2011ExhibitsInitiated/ Startedduring theyear 2011Total Number <strong>of</strong>Exhibits awaitingExamination in2011, (3)+(4)Exhibits Disposed<strong>of</strong>f during theyear 2011, (BothCurrent & Old)ExhibitsPending ason Ist. Jan.<strong>2012</strong>, (5)-(6)(1) (2) (3) (4) (5) (6) (7)1 Andhra Pradesh 588 94,482 95,070 90,704 4,3662 Arunachal Pradesh 29 251 280 251 293 Assam 12,113 29,948 42,061 27,051 15,0104 Bihar 2,808 2,126 4,934 2,329 2,6055 Chhattisgarh 11,457 5,207 16,664 4,249 12,4156 Goa 206 348 554 301 2537 Gujarat 5,582 335,277 340,859 336,109 4,7508 Haryana 1,635 9,778 11,413 10,005 1,4089 Himachal Pradesh 308 5,140 5,448 4,907 54110 Jammu & Kashmir 14,511 44,326 58,837 44,965 13,87211 Jharkh<strong>and</strong> NA NA NA NA NA12 Karnataka 12,307 82,107 94,414 86,077 8,33713 Kerala 32,724 112,652 145,376 72,551 72,82514 Madhya Pradesh 14,491 19,202 33,693 23,855 9,83815 Maharashtra NA NA NA NA NA16 Manipur 36,077 5,669 41,746 6,310 35,43617 Meghalaya 779 2,831 3,610 2,223 1,38718 Mizoram 77 3,870 3,947 3,706 24119 Nagal<strong>and</strong> 4 225 229 229 020 Orissa 53,304 75,509 128,813 43,515 85,29821 Punjab 176,847 115,438 292,285 170,960 121,32522 Rajasthan 13,835 24,229 38,064 23,010 15,05423 Sikkim 192 208 400 79 32124 Tamil Nadu 76,752 228,693 305,445 252,851 52,59425 Tripura 1,138 2,676 3,814 3,688 12626 Uttar Pradesh 6,617 23,230 29,847 21,579 8,26827 Uttarakh<strong>and</strong> 161 765 926 794 13228 West Bengal 52,325 21,458 73,783 17,393 56,39029 A&N Isl<strong>and</strong>s 9 438 447 447 030 Ch<strong>and</strong>igarh 733 611 1,344 814 53031 D&N Haveli 0 0 0 0 032 Daman & Diu 0 0 0 0 033 Delhi 5,768 3,540 9,308 3,472 5,83634 Lakshadweep 6 2 8 2 635 Puducherry 101 669 770 414 356All India 533,484 1,250,905 1,784,389 1,254,840 529,549NA: Not Available