2012 - Bureau of Police Research and Development
2012 - Bureau of Police Research and Development
2012 - Bureau of Police Research and Development

Create successful ePaper yourself
Turn your PDF publications into a flip-book with our unique Google optimized e-Paper software.
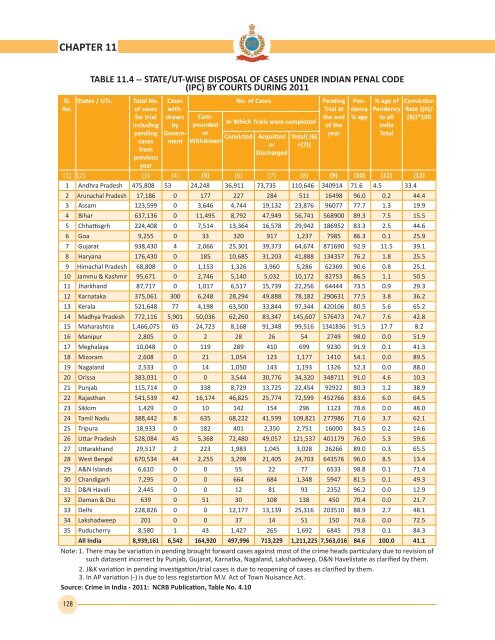
CHAPTER 11Sl.No.128TABLE 11.4 -- STATE/UT-WISE DISPOSAL OF CASES UNDER INDIAN PENAL CODE(IPC) BY COURTS DURING 2011States / UTs.Total No.<strong>of</strong> casesfor trialincludingpendingcasesfrompreviousyearCompoundedorWithdrawnNo. <strong>of</strong> CasesIn Which Trials were completedConvictedAcquittedorDischargedTotal{ (6)+(7)}PendingTrial atthe end<strong>of</strong> theyearCaseswithdrawnbyGovernmentPendency% age% age <strong>of</strong>Pendencyto allIndiaTotalConvictionRate {(6)/(8)}*100(1) (2) (3) (4) (5) (6) (7) (8) (9) (10) (11) (12)1 Andhra Pradesh 475,808 53 24,248 36,911 73,735 110,646 340914 71.6 4.5 33.42 Arunachal Pradesh 17,186 0 177 227 284 511 16498 96.0 0.2 44.43 Assam 123,599 0 3,646 4,744 19,132 23,876 96077 77.7 1.3 19.94 Bihar 637,136 0 11,495 8,792 47,949 56,741 568900 89.3 7.5 15.55 Chhattisgrh 224,408 0 7,514 13,364 16,578 29,942 186952 83.3 2.5 44.66 Goa 9,255 0 33 320 917 1,237 7985 86.3 0.1 25.97 Gujarat 938,430 4 2,066 25,301 39,373 64,674 871690 92.9 11.5 39.18 Haryana 176,430 0 185 10,685 31,203 41,888 134357 76.2 1.8 25.59 Himachal Pradesh 68,808 0 1,153 1,326 3,960 5,286 62369 90.6 0.8 25.110 Jammu & Kashmir 95,671 0 2,746 5,140 5,032 10,172 82753 86.5 1.1 50.511 Jharkh<strong>and</strong> 87,717 0 1,017 6,517 15,739 22,256 64444 73.5 0.9 29.312 Karnataka 375,061 300 6,248 28,294 49,888 78,182 290631 77.5 3.8 36.213 Kerala 521,648 77 4,198 63,500 33,844 97,344 420106 80.5 5.6 65.214 Madhya Pradesh 772,116 5,901 50,036 62,260 83,347 145,607 576473 74.7 7.6 42.815 Maharashtra 1,466,075 65 24,723 8,168 91,348 99,516 1341836 91.5 17.7 8.216 Manipur 2,805 0 2 28 26 54 2749 98.0 0.0 51.917 Meghalaya 10,048 0 119 289 410 699 9230 91.9 0.1 41.318 Mizoram 2,608 0 21 1,054 123 1,177 1410 54.1 0.0 89.519 Nagal<strong>and</strong> 2,533 0 14 1,050 143 1,193 1326 52.3 0.0 88.020 Orissa 383,031 0 0 3,544 30,776 34,320 348711 91.0 4.6 10.321 Punjab 115,714 0 338 8,729 13,725 22,454 92922 80.3 1.2 38.922 Rajasthan 541,539 42 16,174 46,825 25,774 72,599 452766 83.6 6.0 64.523 Sikkim 1,429 0 10 142 154 296 1123 78.6 0.0 48.024 Tamil Nadu 388,442 8 635 68,222 41,599 109,821 277986 71.6 3.7 62.125 Tripura 18,933 0 182 401 2,350 2,751 16000 84.5 0.2 14.626 Uttar Pradesh 528,084 45 5,368 72,480 49,057 121,537 401179 76.0 5.3 59.627 Uttarakh<strong>and</strong> 29,517 2 223 1,983 1,045 3,028 26266 89.0 0.3 65.528 West Bengal 670,534 44 2,255 3,298 21,405 24,703 643576 96.0 8.5 13.429 A&N Isl<strong>and</strong>s 6,610 0 0 55 22 77 6533 98.8 0.1 71.430 Ch<strong>and</strong>igarh 7,295 0 0 664 684 1,348 5947 81.5 0.1 49.331 D&N Haveli 2,445 0 0 12 81 93 2352 96.2 0.0 12.932 Daman & Diu 639 0 51 30 108 138 450 70.4 0.0 21.733 Delhi 228,826 0 0 12,177 13,139 25,316 203510 88.9 2.7 48.134 Lakshadweep 201 0 0 37 14 51 150 74.6 0.0 72.535 Puducherry 8,580 1 43 1,427 265 1,692 6845 79.8 0.1 84.3All India 8,939,161 6,542 164,920 497,996 713,229 1,211,225 7,563,016 84.6 100.0 41.1Note: 1. There may be variation in pending brought forward cases against most <strong>of</strong> the crime heads particulary due to revision <strong>of</strong>such datasent incorrect by Punjab, Gujarat, Karnatka, Nagal<strong>and</strong>, Lakshadweep, D&N Havelistate as clarified by them.2. J&K variation in pending investigation/trial cases is due to reopening <strong>of</strong> cases as clarified by them.3. In AP variation (-) is due to less registartion M.V. Act <strong>of</strong> Town Nuisance Act.Source: Crime in India - 2011: NCRB Publication, Table No. 4.10