2012 - Bureau of Police Research and Development
2012 - Bureau of Police Research and Development
2012 - Bureau of Police Research and Development

You also want an ePaper? Increase the reach of your titles
YUMPU automatically turns print PDFs into web optimized ePapers that Google loves.
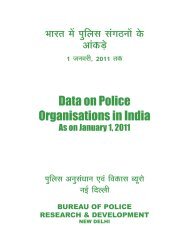
CHAPTER 1BASIC POLICE DATAState Wise Basic <strong>Police</strong> Data• <strong>Police</strong> – Population Ratio• <strong>Police</strong> – Area Ratio(Number <strong>of</strong> <strong>Police</strong>men per 100 Sq. Kms.)• Number <strong>of</strong> Vehicles per 100 <strong>Police</strong>menThis chapter attempts to provide youwith the collated data on basic police issues inthe country, which you may not find throughnormal published sources. The information inthis chapter is as on 01.01.<strong>2012</strong> along with theanalysis there<strong>of</strong> for eleven years from 2001to 2011 for alternate years. The data coversall the States <strong>and</strong> the Union Territories <strong>of</strong> thecountry.The basic police data gives the informationon Sanctioned Strength <strong>of</strong> Civil & Armed<strong>Police</strong>, Population per <strong>Police</strong>man i.e. <strong>Police</strong> -Population Ratio, Area per <strong>Police</strong>man, Number<strong>of</strong> <strong>Police</strong> Zones, Ranges, Districts, Circles, <strong>Police</strong>Stations, <strong>Police</strong> Posts <strong>and</strong> Number <strong>of</strong> Armed<strong>Police</strong> Battalions in the country.An analysis <strong>of</strong> national data on police forthe period <strong>of</strong> last eleven years for alternateyears is given in Table-A which gives percentagewise changes with reference to the precedingyear <strong>and</strong> also with reference to eleven yearsperiod from 2001 to 2011. Thus the percentagechange shall be for 2 years block.<strong>Police</strong>-Population RatioIt shows that percentage wise growth inthe sanctioned police strength in our countryhas shown decrease <strong>of</strong> 42.27% whereas thegrowth in population was 16.18% during thelast eleven years. As a result there<strong>of</strong>, it is seenthat 695 people were being looked after byone constable in the year 2001, which hasdecreased to 568 people required to be lookedafter by one constable in the year 2011 despitemany fold increase in challenges faced by policeforces in the country <strong>and</strong> significant increase inthe incidence <strong>of</strong> terrorism, communal violence,naxalism, security threats etc.Year 2001 2011 % increaseTotal population(In crores) 103.79 120.58 16.18(in millions) 1037.95 1205.87Total <strong>Police</strong> Strength(In lakhs) 14.93 21.24 42.27(in millions) 1.49 2.12The actual availability <strong>of</strong> <strong>Police</strong>men getsfurther reduced owing to vacancies runningupto 25.39% as on 1.1.<strong>2012</strong>. During this elevenyear period the State Armed <strong>Police</strong> Forces haveshown an increase <strong>of</strong> 24.20% from 3.47 lakhsi.e (0.347 million) in the year 2001 to 4.31 lakhsi.e (0.431 million) in the year 2011. Details <strong>of</strong>Population per <strong>Police</strong>man for the Sanctionedas well as the Actual <strong>Police</strong> Strength are shownin the Table – 1.3. (Page No.15)Area <strong>of</strong> Supervision (from 47.16 policemenper 100 Sq. Km. in 2001 to 67.10 <strong>Police</strong>menin 2011)The <strong>Police</strong> - Area Ratio (number <strong>of</strong>policemen per 100 sq. kms.) has increased by42.28% during eleven years period <strong>of</strong> 2001 to2011. At national level, as on 01.01.<strong>2012</strong>, wehad an average <strong>of</strong> one constable for every 1.49sq. kms. <strong>of</strong> our geographical area. In the lesspopulous states like Arunachal Pradesh, forthe Sanctioned Strength this ratio was highestat 1:7.27 sq. kms. followed by Rajasthan with1:4.07 sq. kms. <strong>and</strong> in the densely populatedStates/UTs it was lowest in Ch<strong>and</strong>igarh at1:0.01 sq. kms followed by Delhi at 1:0.02sq. kms. Details <strong>of</strong> <strong>Police</strong>-Area Ratio forsanctioned <strong>and</strong> Actual <strong>Police</strong> Strength aregiven in Table – 1.3. (Page No. 15)1