2012 - Bureau of Police Research and Development
2012 - Bureau of Police Research and Development
2012 - Bureau of Police Research and Development

You also want an ePaper? Increase the reach of your titles
YUMPU automatically turns print PDFs into web optimized ePapers that Google loves.
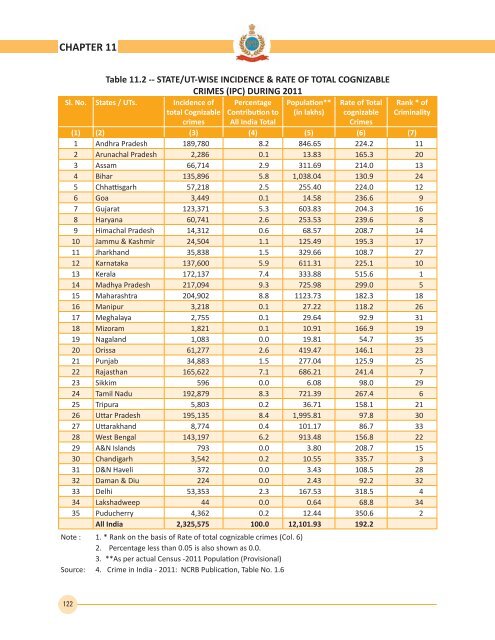
CHAPTER 11Table 11.2 -- STATE/UT-WISE INCIDENCE & RATE OF TOTAL COGNIZABLECRIMES (IPC) DURING 2011Percentage Population** Rate <strong>of</strong> TotalContribution to (in lakhs) cognizableAll India TotalCrimesSl. No. States / UTs. Incidence <strong>of</strong>total CognizablecrimesRank * <strong>of</strong>Criminality(1) (2) (3) (4) (5) (6) (7)1 Andhra Pradesh 189,780 8.2 846.65 224.2 112 Arunachal Pradesh 2,286 0.1 13.83 165.3 203 Assam 66,714 2.9 311.69 214.0 134 Bihar 135,896 5.8 1,038.04 130.9 245 Chhattisgarh 57,218 2.5 255.40 224.0 126 Goa 3,449 0.1 14.58 236.6 97 Gujarat 123,371 5.3 603.83 204.3 168 Haryana 60,741 2.6 253.53 239.6 89 Himachal Pradesh 14,312 0.6 68.57 208.7 1410 Jammu & Kashmir 24,504 1.1 125.49 195.3 1711 Jharkh<strong>and</strong> 35,838 1.5 329.66 108.7 2712 Karnataka 137,600 5.9 611.31 225.1 1013 Kerala 172,137 7.4 333.88 515.6 114 Madhya Pradesh 217,094 9.3 725.98 299.0 515 Maharashtra 204,902 8.8 1123.73 182.3 1816 Manipur 3,218 0.1 27.22 118.2 2617 Meghalaya 2,755 0.1 29.64 92.9 3118 Mizoram 1,821 0.1 10.91 166.9 1919 Nagal<strong>and</strong> 1,083 0.0 19.81 54.7 3520 Orissa 61,277 2.6 419.47 146.1 2321 Punjab 34,883 1.5 277.04 125.9 2522 Rajasthan 165,622 7.1 686.21 241.4 723 Sikkim 596 0.0 6.08 98.0 2924 Tamil Nadu 192,879 8.3 721.39 267.4 625 Tripura 5,803 0.2 36.71 158.1 2126 Uttar Pradesh 195,135 8.4 1,995.81 97.8 3027 Uttarakh<strong>and</strong> 8,774 0.4 101.17 86.7 3328 West Bengal 143,197 6.2 913.48 156.8 2229 A&N Isl<strong>and</strong>s 793 0.0 3.80 208.7 1530 Ch<strong>and</strong>igarh 3,542 0.2 10.55 335.7 331 D&N Haveli 372 0.0 3.43 108.5 2832 Daman & Diu 224 0.0 2.43 92.2 3233 Delhi 53,353 2.3 167.53 318.5 434 Lakshadweep 44 0.0 0.64 68.8 3435 Puducherry 4,362 0.2 12.44 350.6 2All India 2,325,575 100.0 12,101.93 192.2Note : 1. * Rank on the basis <strong>of</strong> Rate <strong>of</strong> total cognizable crimes (Col. 6)2. Percentage less than 0.05 is also shown as 0.0.3. **As per actual Census -2011 Population (Provisional)Source: 4. Crime in India - 2011: NCRB Publication, Table No. 1.6122