2012 - Bureau of Police Research and Development
2012 - Bureau of Police Research and Development
2012 - Bureau of Police Research and Development

Create successful ePaper yourself
Turn your PDF publications into a flip-book with our unique Google optimized e-Paper software.
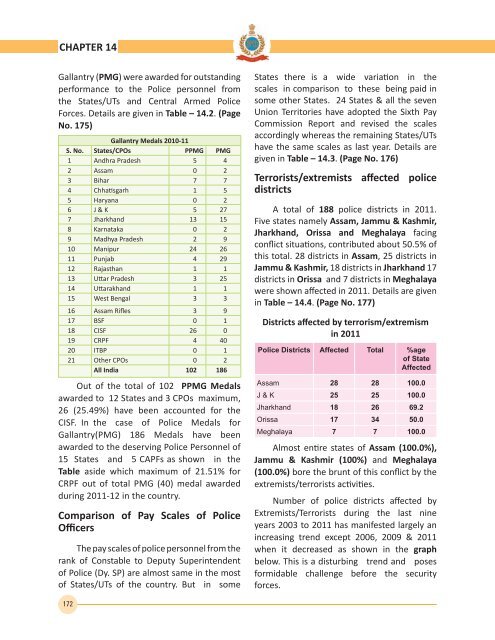
CHAPTER 14Gallantry (PMG) were awarded for outst<strong>and</strong>ingperformance to the <strong>Police</strong> personnel fromthe States/UTs <strong>and</strong> Central Armed <strong>Police</strong>Forces. Details are given in Table – 14.2. (PageNo. 175)Gallantry Medals 2010-11S. No. States/CPOs PPMG PMG1 Andhra Pradesh 5 42 Assam 0 23 Bihar 7 74 Chhatisgarh 1 55 Haryana 0 26 J & K 5 277 Jharkh<strong>and</strong> 13 158 Karnataka 0 29 Madhya Pradesh 2 910 Manipur 24 2611 Punjab 4 2912 Rajasthan 1 113 Uttar Pradesh 3 2514 Uttarakh<strong>and</strong> 1 115 West Bengal 3 316 Assam Rifles 3 917 BSF 0 118 cISF 26 019 cRPF 4 4020 ITBP 0 121 Other cPOs 0 2All India 102 186Out <strong>of</strong> the total <strong>of</strong> 102 PPMG Medalsawarded to 12 States <strong>and</strong> 3 cPOs maximum,26 (25.49%) have been accounted for theCISF. In the case <strong>of</strong> <strong>Police</strong> Medals forGallantry(PMG) 186 Medals have beenawarded to the deserving <strong>Police</strong> Personnel <strong>of</strong>15 States <strong>and</strong> 5 cAPFs as shown in theTable aside which maximum <strong>of</strong> 21.51% forCRPF out <strong>of</strong> total PMG (40) medal awardedduring 2011-12 in the country.Comparison <strong>of</strong> Pay Scales <strong>of</strong> <strong>Police</strong>OfficersThe pay scales <strong>of</strong> police personnel from therank <strong>of</strong> Constable to Deputy Superintendent<strong>of</strong> <strong>Police</strong> (Dy. SP) are almost same in the most<strong>of</strong> States/UTs <strong>of</strong> the country. But in someStates there is a wide variation in thescales in comparison to these being paid insome other States. 24 States & all the sevenUnion Territories have adopted the Sixth PayCommission Report <strong>and</strong> revised the scalesaccordingly whereas the remaining States/UTshave the same scales as last year. Details aregiven in Table – 14.3. (Page No. 176)Terrorists/extremists affected policedistrictsA total <strong>of</strong> 188 police districts in 2011.Five states namely Assam, Jammu & Kashmir,Jharkh<strong>and</strong>, Orissa <strong>and</strong> Meghalaya facingconflict situations, contributed about 50.5% <strong>of</strong>this total. 28 districts in Assam, 25 districts inJammu & Kashmir, 18 districts in Jharkh<strong>and</strong> 17districts in Orissa <strong>and</strong> 7 districts in Meghalayawere shown affected in 2011. Details are givenin Table – 14.4. (Page No. 177)Districts affected by terrorism/extremismin 2011<strong>Police</strong> Districts Affected Total %age<strong>of</strong> StateAffectedAssam 28 28 100.0J & K 25 25 100.0Jharkh<strong>and</strong> 18 26 69.2Orissa 17 34 50.0Meghalaya 7 7 100.0Almost entire states <strong>of</strong> Assam (100.0%),Jammu & Kashmir (100%) <strong>and</strong> Meghalaya(100.0%) bore the brunt <strong>of</strong> this conflict by theextremists/terrorists activities.Number <strong>of</strong> police districts affected byExtremists/Terrorists during the last nineyears 2003 to 2011 has manifested largely anincreasing trend except 2006, 2009 & 2011when it decreased as shown in the graphbelow. This is a disturbing trend <strong>and</strong> posesformidable challenge before the securityforces.172