2012 - Bureau of Police Research and Development
2012 - Bureau of Police Research and Development
2012 - Bureau of Police Research and Development

Create successful ePaper yourself
Turn your PDF publications into a flip-book with our unique Google optimized e-Paper software.
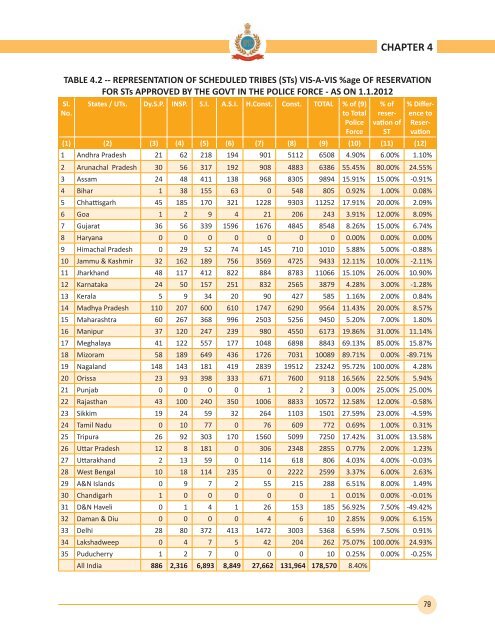
CHAPTER 4TABLE 4.2 -- REPRESENTATION OF SCHEDULED TRIBES (STs) VIS-A-VIS %age OF RESERVATIONFOR STs APPROVED BY THE GOVT IN THE POLICE FORCE - AS ON 1.1.<strong>2012</strong>Sl.No.States / UTs. Dy.S.P. INSP. S.I. A.S.I. H.Const. Const. TOTAL % <strong>of</strong> (9)to Total<strong>Police</strong>Force% <strong>of</strong>reservation<strong>of</strong>ST% DifferencetoReservation(1) (2) (3) (4) (5) (6) (7) (8) (9) (10) (11) (12)1 Andhra Pradesh 21 62 218 194 901 5112 6508 4.90% 6.00% 1.10%2 Arunachal Pradesh 30 56 317 192 908 4883 6386 55.45% 80.00% 24.55%3 Assam 24 48 411 138 968 8305 9894 15.91% 15.00% -0.91%4 Bihar 1 38 155 63 0 548 805 0.92% 1.00% 0.08%5 Chhattisgarh 45 185 170 321 1228 9303 11252 17.91% 20.00% 2.09%6 Goa 1 2 9 4 21 206 243 3.91% 12.00% 8.09%7 Gujarat 36 56 339 1596 1676 4845 8548 8.26% 15.00% 6.74%8 Haryana 0 0 0 0 0 0 0 0.00% 0.00% 0.00%9 Himachal Pradesh 0 29 52 74 145 710 1010 5.88% 5.00% -0.88%10 Jammu & Kashmir 32 162 189 756 3569 4725 9433 12.11% 10.00% -2.11%11 Jharkh<strong>and</strong> 48 117 412 822 884 8783 11066 15.10% 26.00% 10.90%12 Karnataka 24 50 157 251 832 2565 3879 4.28% 3.00% -1.28%13 Kerala 5 9 34 20 90 427 585 1.16% 2.00% 0.84%14 Madhya Pradesh 110 207 600 610 1747 6290 9564 11.43% 20.00% 8.57%15 Maharashtra 60 267 368 996 2503 5256 9450 5.20% 7.00% 1.80%16 Manipur 37 120 247 239 980 4550 6173 19.86% 31.00% 11.14%17 Meghalaya 41 122 557 177 1048 6898 8843 69.13% 85.00% 15.87%18 Mizoram 58 189 649 436 1726 7031 10089 89.71% 0.00% -89.71%19 Nagal<strong>and</strong> 148 143 181 419 2839 19512 23242 95.72% 100.00% 4.28%20 Orissa 23 93 398 333 671 7600 9118 16.56% 22.50% 5.94%21 Punjab 0 0 0 0 1 2 3 0.00% 25.00% 25.00%22 Rajasthan 43 100 240 350 1006 8833 10572 12.58% 12.00% -0.58%23 Sikkim 19 24 59 32 264 1103 1501 27.59% 23.00% -4.59%24 Tamil Nadu 0 10 77 0 76 609 772 0.69% 1.00% 0.31%25 Tripura 26 92 303 170 1560 5099 7250 17.42% 31.00% 13.58%26 Uttar Pradesh 12 8 181 0 306 2348 2855 0.77% 2.00% 1.23%27 Uttarakh<strong>and</strong> 2 13 59 0 114 618 806 4.03% 4.00% -0.03%28 West Bengal 10 18 114 235 0 2222 2599 3.37% 6.00% 2.63%29 A&N Isl<strong>and</strong>s 0 9 7 2 55 215 288 6.51% 8.00% 1.49%30 Ch<strong>and</strong>igarh 1 0 0 0 0 0 1 0.01% 0.00% -0.01%31 D&N Haveli 0 1 4 1 26 153 185 56.92% 7.50% -49.42%32 Daman & Diu 0 0 0 0 4 6 10 2.85% 9.00% 6.15%33 Delhi 28 80 372 413 1472 3003 5368 6.59% 7.50% 0.91%34 Lakshadweep 0 4 7 5 42 204 262 75.07% 100.00% 24.93%35 Puducherry 1 2 7 0 0 0 10 0.25% 0.00% -0.25%All India 886 2,316 6,893 8,849 27,662 131,964 178,570 8.40%79