2012 - Bureau of Police Research and Development
2012 - Bureau of Police Research and Development
2012 - Bureau of Police Research and Development

Create successful ePaper yourself
Turn your PDF publications into a flip-book with our unique Google optimized e-Paper software.
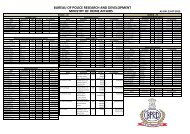
CHAPTER 4TABLE 4.3 -- REPRESENTATION OF OTHER BACKWARD CLASSES (OBCs) VIS-A-VIS %age OFRESERVATION FOR (OBCs) APPROVED BY THE GOVT IN THE POLICE FORCE - AS ON 1.1.<strong>2012</strong>Sl.No.80States / UTs. Dy.S.P. INSP. S.I. A.S.I. H.Const. Const. TOTAL % <strong>of</strong> (9)to Total<strong>Police</strong>Force% <strong>of</strong>reservation<strong>of</strong> OBC% <strong>of</strong>DifferencetoReservation(1) (2) (3) (4) (5) (6) (7) (8) (9) (10) (11) (12)1 Andhra Pradesh 68 183 527 622 2347 17001 20748 15.63% 25.00% 9.37%2 Arunachal Pradesh 0 0 0 0 0 0 0 0.00% 0.00% 0.00%3 Assam 56 216 1435 769 2616 15368 20460 32.91% 27.00% -5.91%4 Bihar NA NA NA NA NA 18688 18688 21.40% 33.00% 11.60%5 Chhattisgarh 20 23 127 188 666 4017 5041 8.02% 14.00% 5.98%6 Goa 12 7 22 5 232 996 1274 20.48% 19.50% -0.98%7 Gujarat 3 0 648 2100 2231 9620 14602 14.10% 27.00% 12.90%8 Haryana 11 174 298 510 1145 6290 8428 13.69% 27.00% 13.31%9 Himachal Pradesh 0 11 48 44 182 1208 1493 8.69% 18.00% 9.31%10 Jammu & Kashmir 1 10 41 21 73 437 583 0.75% 1.00% 0.25%11 Jharkh<strong>and</strong> 6 52 330 402 847 7179 8816 12.03% 14.00% 1.97%12 Karnataka 312 976 1339 2976 13435 30700 49738 54.82% 33.00% -21.82%13 Kerala 86 149 574 578 3374 13067 17828 35.39% 40.00% 4.61%14 Madhya Pradesh 39 37 267 348 736 5449 6876 8.22% 14.00% 5.78%15 Maharashtra 0 47 880 2704 6795 14266 24692 13.58% 19.00% 5.42%16 Manipur 0 1 15 14 97 492 619 1.99% 17.00% 15.01%17 Meghalaya NA 10 20 33 35 307 405 3.17% 0.00% -3.17%18 Mizoram 0 0 0 0 0 0 0 0.00% 0.00% 0.00%19 Nagal<strong>and</strong> 0 0 0 0 0 0 0 0.00% 0.00% 0.00%20 Orissa 2 66 317 325 375 8069 9154 16.62% 27.00% 10.38%21 Punjab 10 116 295 673 2,084 9,747 12925 16.27% 12.00% -4.27%22 Rajasthan 123 56 348 136 230 9757 10650 12.67% 21.00% 8.33%23 Sikkim 15 24 80 56 215 770 1160 21.32% 14.00% -7.32%24 Tamil Nadu 481 1728 4192 0 6374 43424 56199 50.02% 50.00% -0.02%25 Tripura 0 0 0 0 0 0 0 0.00% 0.00% 0.00%26 Uttar Pradesh 188 271 2449 0 4133 31703 38744 10.51% 27.00% 16.49%27 Uttarakh<strong>and</strong> 3 6 66 0 96 2547 2718 13.59% 14.00% 0.41%28 West Bengal 11 13 168 243 0 1304 1739 2.26% 17.00% 14.74%29 A&N Isl<strong>and</strong>s 0 0 17 0 0 237 254 5.74% 38.00% 32.26%30 Ch<strong>and</strong>igarh 0 4 31 27 120 1309 1491 18.94% 27.00% 8.06%31 D&N Haveli 0 0 0 1 0 9 10 3.08% 5.00% 1.92%32 Daman & Diu 0 0 0 0 14 31 45 12.82% 27.00% 14.18%33 Delhi 5 0 587 17 1711 13620 15940 19.57% 27.00% 7.43%34 Lakshadweep 0 0 0 0 2 0 2 0.57% 0.00% -0.57%35 Puducherry 0 0 15 0 0 500 515 13.03% 34.00% 20.97%All India 1,452 4,180 15,136 12,792 50,165 2,68,112 3,51,837 16.56%NA: Not Available