

SCHRIFTENREIHE Institut für Pflanzenernährung und Bodenkunde ...
SCHRIFTENREIHE Institut für Pflanzenernährung und Bodenkunde ...
SCHRIFTENREIHE Institut für Pflanzenernährung und Bodenkunde ...

Create successful ePaper yourself
Turn your PDF publications into a flip-book with our unique Google optimized e-Paper software.
Chapter 5 Modeling Grazing Effects on Coupled Water and Heat Fluxes in Inner Mongolia Grassland<br />
six unknown parameters (θr, θs, α, n, Ks, and L). Hence, our three-layer soil<br />
profile (second and third depths were combined in one layer) may have as many<br />
as 18 unknown variables. To improve the optimization efficiency, the parameters<br />
θs, α, n, and Ks were simultaneously optimized in all layers with other<br />
parameters (i.e., θr and L) constant using time series of observations of θw for<br />
each depth. For a preliminary sensitive analysis, we also mixed the simulation 1<br />
and simulation 2, i.e., combined θr, θs, α, and n from LDP but Ks from NN<br />
(LDP-NN; simulation 4) and combined Ks from LDP but θr, θs, α, and n from NN<br />
(LDP+NN; simulation 5), respectively. The model was calibrated in 2004 and<br />
validated in 2005 and 2006. Optimizing efficiency, as well as model efficiency<br />
was evaluated by the root mean square errors (RMSE):<br />
RMSE<br />
=<br />
N<br />
1 2<br />
N ∑ Pi<br />
− Oi<br />
)<br />
i=<br />
1<br />
( [8]<br />
where N is the number of observations and Pi and Oi are the simulated and<br />
measured values, respectively.<br />
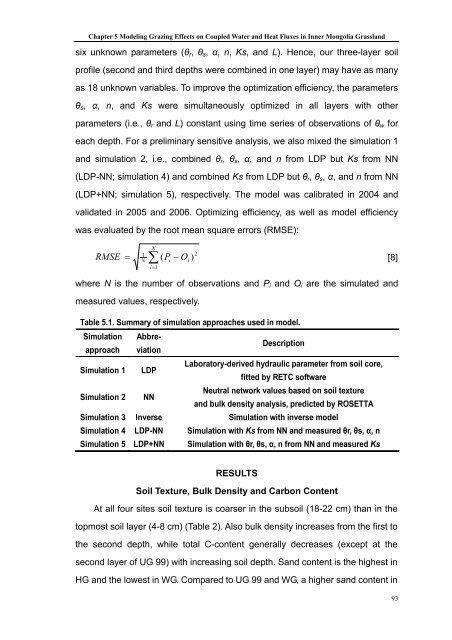
Table 5.1. Summary of simulation approaches used in model.<br />
Simulation<br />
approach<br />
Abbreviation<br />
Description<br />
Simulation 1 LDP<br />
Laboratory-derived hydraulic parameter from soil core,<br />
fitted by RETC software<br />
Simulation 2 NN<br />
Neutral network values based on soil texture<br />
and bulk density analysis, predicted by ROSETTA<br />
Simulation 3 Inverse Simulation with inverse model<br />
Simulation 4 LDP-NN Simulation with Ks from NN and measured θr, θs, α, n<br />
Simulation 5 LDP+NN Simulation with θr, θs, α, n from NN and measured Ks<br />
RESULTS<br />
Soil Texture, Bulk Density and Carbon Content<br />
At all four sites soil texture is coarser in the subsoil (18-22 cm) than in the<br />
topmost soil layer (4-8 cm) (Table 2). Also bulk density increases from the first to<br />
the second depth, while total C-content generally decreases (except at the<br />
second layer of UG 99) with increasing soil depth. Sand content is the highest in<br />
HG and the lowest in WG. Compared to UG 99 and WG, a higher sand content in<br />
93