

SCHRIFTENREIHE Institut für Pflanzenernährung und Bodenkunde ...
SCHRIFTENREIHE Institut für Pflanzenernährung und Bodenkunde ...
SCHRIFTENREIHE Institut für Pflanzenernährung und Bodenkunde ...

Create successful ePaper yourself
Turn your PDF publications into a flip-book with our unique Google optimized e-Paper software.
Chapter 3 Spatio-temporal variability of soil moisture in grazed steppe areas investigated by geostatistics<br />
ha area ungrazed since 1979 (UG 79); (2) 35 ha area ungrazed since 1999 (UG<br />
99); (3) 40 ha area winter grazed only, with 0.5 sheep units (ewe and lamb) ha -1<br />
yr -1 (WG); (4) 250 ha area continuously grazed, with 1.2 sheep units ha -1 yr -1<br />
(CG); and (5) 100 ha area heavily grazed, with 2.0 sheep units ha -1 yr -1 (HG).<br />
The plots were adjacent to each other, apart from HG, which was 2.5 km away<br />
but on similar soils and topography. Prior to 1979, all plots were grazed at low<br />
grazing intensity. All plots except UG 79 were grazed at moderate grazing<br />
intensity from 1979 to 1999 and fenced in 1999.<br />
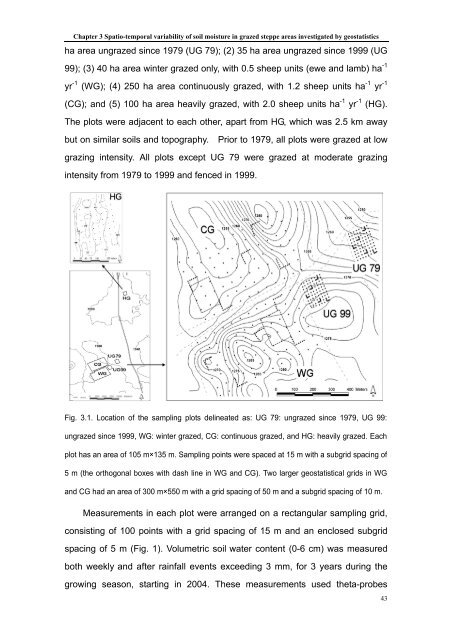
Fig. 3.1. Location of the sampling plots delineated as: UG 79: ungrazed since 1979, UG 99:<br />
ungrazed since 1999, WG: winter grazed, CG: continuous grazed, and HG: heavily grazed. Each<br />
plot has an area of 105 m×135 m. Sampling points were spaced at 15 m with a subgrid spacing of<br />
5 m (the orthogonal boxes with dash line in WG and CG). Two larger geostatistical grids in WG<br />
and CG had an area of 300 m×550 m with a grid spacing of 50 m and a subgrid spacing of 10 m.<br />
Measurements in each plot were arranged on a rectangular sampling grid,<br />
consisting of 100 points with a grid spacing of 15 m and an enclosed subgrid<br />
spacing of 5 m (Fig. 1). Volumetric soil water content (0-6 cm) was measured<br />
both weekly and after rainfall events exceeding 3 mm, for 3 years during the<br />
growing season, starting in 2004. These measurements used theta-probes<br />
43