

SCHRIFTENREIHE Institut für Pflanzenernährung und Bodenkunde ...
SCHRIFTENREIHE Institut für Pflanzenernährung und Bodenkunde ...
SCHRIFTENREIHE Institut für Pflanzenernährung und Bodenkunde ...

You also want an ePaper? Increase the reach of your titles
YUMPU automatically turns print PDFs into web optimized ePapers that Google loves.
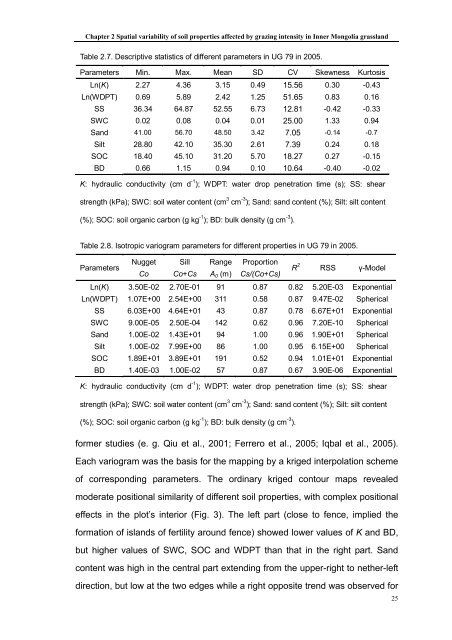
Chapter 2 Spatial variability of soil properties affected by grazing intensity in Inner Mongolia grassland<br />
Table 2.7. Descriptive statistics of different parameters in UG 79 in 2005.<br />
Parameters Min. Max. Mean SD CV Skewness Kurtosis<br />
Ln(K) 2.27 4.36 3.15 0.49 15.56 0.30 -0.43<br />
Ln(WDPT) 0.69 5.89 2.42 1.25 51.65 0.83 0.16<br />
SS 36.34 64.87 52.55 6.73 12.81 -0.42 -0.33<br />
SWC 0.02 0.08 0.04 0.01 25.00 1.33 0.94<br />
Sand 41.00 56.70 48.50 3.42 7.05 -0.14 -0.7<br />
Silt 28.80 42.10 35.30 2.61 7.39 0.24 0.18<br />
SOC 18.40 45.10 31.20 5.70 18.27 0.27 -0.15<br />
BD 0.66 1.15 0.94 0.10 10.64 -0.40 -0.02<br />
K: hydraulic conductivity (cm d -1 ); WDPT: water drop penetration time (s); SS: shear<br />
strength (kPa); SWC: soil water content (cm 3 cm -3 ); Sand: sand content (%); Silt: silt content<br />
(%); SOC: soil organic carbon (g kg -1 ); BD: bulk density (g cm -3 ).<br />
Table 2.8. Isotropic variogram parameters for different properties in UG 79 in 2005.<br />
Parameters<br />
Nugget<br />
Co<br />
Sill<br />
Co+Cs<br />
Range<br />
A0 (m)<br />
Proportion<br />
Cs/(Co+Cs)<br />
R 2 RSS γ-Model<br />
Ln(K) 3.50E-02 2.70E-01 91 0.87 0.82 5.20E-03 Exponential<br />
Ln(WDPT) 1.07E+00 2.54E+00 311 0.58 0.87 9.47E-02 Spherical<br />
SS 6.03E+00 4.64E+01 43 0.87 0.78 6.67E+01 Exponential<br />
SWC 9.00E-05 2.50E-04 142 0.62 0.96 7.20E-10 Spherical<br />
Sand 1.00E-02 1.43E+01 94 1.00 0.96 1.90E+01 Spherical<br />
Silt 1.00E-02 7.99E+00 86 1.00 0.95 6.15E+00 Spherical<br />
SOC 1.89E+01 3.89E+01 191 0.52 0.94 1.01E+01 Exponential<br />
BD 1.40E-03 1.00E-02 57 0.87 0.67 3.90E-06 Exponential<br />
K: hydraulic conductivity (cm d -1 ); WDPT: water drop penetration time (s); SS: shear<br />
strength (kPa); SWC: soil water content (cm 3 cm -3 ); Sand: sand content (%); Silt: silt content<br />
(%); SOC: soil organic carbon (g kg -1 ); BD: bulk density (g cm -3 ).<br />
former studies (e. g. Qiu et al., 2001; Ferrero et al., 2005; Iqbal et al., 2005).<br />
Each variogram was the basis for the mapping by a kriged interpolation scheme<br />
of corresponding parameters. The ordinary kriged contour maps revealed<br />
moderate positional similarity of different soil properties, with complex positional<br />
effects in the plot’s interior (Fig. 3). The left part (close to fence, implied the<br />
formation of islands of fertility aro<strong>und</strong> fence) showed lower values of K and BD,<br />
but higher values of SWC, SOC and WDPT than that in the right part. Sand<br />
content was high in the central part extending from the upper-right to nether-left<br />
direction, but low at the two edges while a right opposite trend was observed for<br />
25