SCHRIFTENREIHE Institut für Pflanzenernährung und Bodenkunde ...
SCHRIFTENREIHE Institut für Pflanzenernährung und Bodenkunde ...
SCHRIFTENREIHE Institut für Pflanzenernährung und Bodenkunde ...
You also want an ePaper? Increase the reach of your titles
YUMPU automatically turns print PDFs into web optimized ePapers that Google loves.
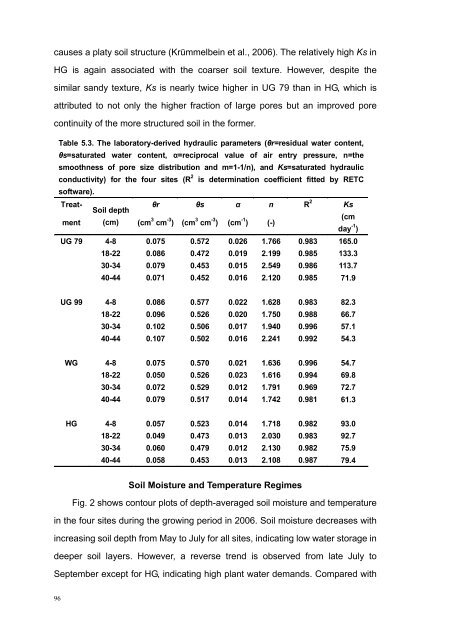
causes a platy soil structure (Krümmelbein et al., 2006). The relatively high Ks in<br />
HG is again associated with the coarser soil texture. However, despite the<br />
similar sandy texture, Ks is nearly twice higher in UG 79 than in HG, which is<br />
attributed to not only the higher fraction of large pores but an improved pore<br />
continuity of the more structured soil in the former.<br />
Table 5.3. The laboratory-derived hydraulic parameters (θr=residual water content,<br />
θs=saturated water content, α=reciprocal value of air entry pressure, n=the<br />
smoothness of pore size distribution and m=1-1/n), and Ks=saturated hydraulic<br />
conductivity) for the four sites (R 2 is determination coefficient fitted by RETC<br />
software).<br />
Treat- θr θs α n R 2 Ks<br />
Soil depth<br />
ment (cm) (cm 3 cm -3 ) (cm 3 cm -3 ) (cm -1 (cm<br />
) (-)<br />
day -1 )<br />
UG 79 4-8 0.075 0.572 0.026 1.766 0.983 165.0<br />
18-22 0.086 0.472 0.019 2.199 0.985 133.3<br />
30-34 0.079 0.453 0.015 2.549 0.986 113.7<br />
40-44 0.071 0.452 0.016 2.120 0.985 71.9<br />
UG 99 4-8 0.086 0.577 0.022 1.628 0.983 82.3<br />
18-22 0.096 0.526 0.020 1.750 0.988 66.7<br />
30-34 0.102 0.506 0.017 1.940 0.996 57.1<br />
40-44 0.107 0.502 0.016 2.241 0.992 54.3<br />
WG 4-8 0.075 0.570 0.021 1.636 0.996 54.7<br />
18-22 0.050 0.526 0.023 1.616 0.994 69.8<br />
30-34 0.072 0.529 0.012 1.791 0.969 72.7<br />
40-44 0.079 0.517 0.014 1.742 0.981 61.3<br />
HG 4-8 0.057 0.523 0.014 1.718 0.982 93.0<br />
18-22 0.049 0.473 0.013 2.030 0.983 92.7<br />
30-34 0.060 0.479 0.012 2.130 0.982 75.9<br />
40-44 0.058 0.453 0.013 2.108 0.987 79.4<br />
Soil Moisture and Temperature Regimes<br />
Fig. 2 shows contour plots of depth-averaged soil moisture and temperature<br />
in the four sites during the growing period in 2006. Soil moisture decreases with<br />
increasing soil depth from May to July for all sites, indicating low water storage in<br />
deeper soil layers. However, a reverse trend is observed from late July to<br />
September except for HG, indicating high plant water demands. Compared with<br />
96


