- Page 3 and 4:
Mendel University in BrnoFaculty of
- Page 5 and 6:
Editors:Ing. Petr Škarpa, Ph.D., A
- Page 7 and 8:
MENDELNET 2013PrefaceThis year´s 2
- Page 9 and 10:
MENDELNET 2013EVALUATION OF BARE SO
- Page 11 and 12:
MENDELNET 2013DESIGN OF THE EQUIPME
- Page 13 and 14:
MENDELNET 2013HOW TO IMPRROVE THE C
- Page 15 and 16:
MENDELNET 2013PREDICTION OF TECHNOL
- Page 17 and 18:
MENDELNET 2013THE DEVICE FOR MECHAN
- Page 19 and 20:
MENDELNET 201317 | P age
- Page 21 and 22:
MENDELNET 201319 | P age
- Page 23 and 24:
MENDELNET 2013INTRODUCTIONThe proce
- Page 25 and 26:
MENDELNET 2013season. Year 2012 had
- Page 27 and 28:
MENDELNET 2013CONCLUSIONSThe aim of
- Page 29 and 30:
MENDELNET 2013WEED INFESTATION OF W
- Page 31 and 32:
MENDELNET 2013Crop sequence in seco
- Page 33 and 34:
MENDELNET 2013the soil in the early
- Page 35 and 36:
MENDELNET 2013INTRODUCTIONThe speci
- Page 37 and 38:
MENDELNET 2013The legend : The infl
- Page 39 and 40:
MENDELNET 2013DETERMINATION OF SPEC
- Page 41 and 42:
MENDELNET 2013Fig. 1 ASD Hand Held
- Page 43 and 44:
MENDELNET 2013Fig. 3 The Spectral R
- Page 45 and 46:
MENDELNET 2013CHANGES IN THE CONTEN
- Page 47 and 48:
MENDELNET 2013after exposure to abi
- Page 49 and 50:
MENDELNET 2013Hoffmann, P. 1988. De
- Page 51 and 52:
MENDELNET 2013INTRODUCTIONTradition
- Page 53 and 54:
MENDELNET 2013Explanation of abbrev
- Page 55 and 56:
MENDELNET 2013CHANGES OF WEED SPECT
- Page 57 and 58:
MENDELNET 2013Data collected in vin
- Page 59 and 60:
MENDELNET 2013REFERENCESANONYM, 200
- Page 61 and 62:
MENDELNET 2013INTRODUCTIONIn the Cz
- Page 63 and 64:
MENDELNET 2013Fig. 4: Concentration
- Page 65 and 66:
MENDELNET 2013SUGAR BEET YIELD PROD
- Page 67 and 68:
MENDELNET 2013RESULT AND DISCUSSION
- Page 69 and 70:
MENDELNET 2013and it was 18.41 t ha
- Page 71 and 72:
MENDELNET 2013DISTRIBUTION OF BARLE
- Page 73 and 74:
MENDELNET 2013RLD (cm.cm -3 )14.012
- Page 75 and 76:
MENDELNET 2013confirmed. In a shall
- Page 77 and 78:
MENDELNET 2013THE IMPACT OF VERMICO
- Page 79 and 80:
MENDELNET 2013fermentation, earthwo
- Page 81 and 82:
MENDELNET 2013Tab. 5 The significan
- Page 83 and 84:
MENDELNET 2013GUTIÉRREZ-MICELI, F.
- Page 85 and 86:
MENDELNET 2013INTRODUCTIONLupin was
- Page 87 and 88:
MENDELNET 2013Graph III. Average yi
- Page 89 and 90:
MENDELNET 2013Picture I. Demage of
- Page 91 and 92:
MENDELNET 2013COMPARISON OF THE ECO
- Page 93 and 94:
MENDELNET 2013Tab. 1 Rape varieties
- Page 95 and 96:
MENDELNET 2013Kč50 000,00Kč45 000
- Page 97 and 98:
MENDELNET 2013INTRODUCTIONSpecific
- Page 99 and 100:
MENDELNET 2013As can be seen from t
- Page 101 and 102:
MENDELNET 2013EVALUATED GRASS SOD A
- Page 103 and 104:
MENDELNET 2013RESULT AND DISCUSSION
- Page 105 and 106:
MENDELNET 2013REFERENCESBEARD, J.B.
- Page 107 and 108:
MENDELNET 2013INTRODUCTIONSemi-natu
- Page 109 and 110:
MENDELNET 2013Influence the intensi
- Page 111 and 112:
MENDELNET 2013THE CHANGES IN STAND
- Page 113 and 114:
MENDELNET 2013ZPS (%) = 0.5 * Σ |x
- Page 115 and 116:
MENDELNET 2013statistically signifi
- Page 117 and 118:
MENDELNET 2013INTRODUCTIONIn the fi
- Page 119 and 120:
MENDELNET 2013data relatively low.
- Page 121 and 122:
MENDELNET 2013LUKAS, V., NEUDERT, L
- Page 123 and 124:
MENDELNET 2013INTRODUCTIONNitrogen
- Page 125 and 126:
MENDELNET 2013This is evident from
- Page 127 and 128:
MENDELNET 2013MONITORING RUSTS OCCU
- Page 129 and 130:
MENDELNET 2013Fig. 1 Susceptibility
- Page 131 and 132:
MENDELNET 2013Roscher Ch., et al. (
- Page 133 and 134:
MENDELNET 2013INTRODUCTIONThe conce
- Page 135 and 136:
MENDELNET 2013DAISY and HERMES have
- Page 137 and 138:
MENDELNET 2013PALOSUO, T., KERSEBAU
- Page 139 and 140:
MENDELNET 2013INTRODUCTIONHops esse
- Page 141 and 142:
MENDELNET 2013According to Basařov
- Page 143 and 144:
MENDELNET 2013TESTING THE VITALITY
- Page 145 and 146:
MENDELNET 2013were compared with fi
- Page 147 and 148:
MENDELNET 2013and laboratory germin
- Page 149 and 150:
MENDELNET 2013EFFECTS OF SOIL CONDI
- Page 151 and 152:
MENDELNET 2013The experiment was co
- Page 153 and 154:
MENDELNET 2013SAIGUSA, M., YAMAMOTO
- Page 155 and 156:
MENDELNET 2013INTRODUCTIONHis Majes
- Page 157 and 158:
MENDELNET 2013Table 3. The cost, re
- Page 159 and 160:
MENDELNET 2013EVALUATION OF SYRIAN
- Page 161 and 162:
MENDELNET 2013genotypes overcame th
- Page 163 and 164:
MENDELNET 2013CONCLUSIONSThe evalua
- Page 165 and 166:
MENDELNET 2013INTRODUCTIONThe conte
- Page 167 and 168:
MENDELNET 2013Table 4. The effect o
- Page 169 and 170:
MENDELNET 2013fertilizer applicatio
- Page 171 and 172:
MENDELNET 2013169 | P age
- Page 173 and 174:
MENDELNET 2013171 | P age
- Page 175 and 176:
MENDELNET 2013INTRODUCTIONIt´s imp
- Page 177 and 178:
MENDELNET 2013demonstrated, that da
- Page 179 and 180:
MENDELNET 2013STABLE MICROCLIMATE I
- Page 181 and 182:
MENDELNET 2013and draught. The temp
- Page 183 and 184:
MENDELNET 2013consequence of consum
- Page 185 and 186:
MENDELNET 2013frequency (4 - 20 hea
- Page 187 and 188:
MENDELNET 2013INTRODUCTIONRaw milk
- Page 189 and 190:
MENDELNET 2013milker's hands, and a
- Page 191 and 192:
MENDELNET 2013INTRODUCTIONThe most
- Page 193 and 194:
MENDELNET 2013Tab. 1 gives results
- Page 195 and 196:
MENDELNET 2013EVALUATION OF THE TRA
- Page 197 and 198:
MENDELNET 2013Fig. 1 Development le
- Page 199 and 200:
MENDELNET 2013USING ICSI IN DIFFERE
- Page 201 and 202:
MENDELNET 2013Oocyte handlingCumula
- Page 203 and 204:
MENDELNET 2013CONCLUSIONSThe presen
- Page 205 and 206:
MENDELNET 2013IN-VITRO ANTIBACTERIA
- Page 207 and 208:
MENDELNET 2013Tab.1. zone of inhibi
- Page 209 and 210:
MENDELNET 2013COMPARISON OF LACTOSE
- Page 211 and 212:
MENDELNET 2013bound to DNA. Chlorid
- Page 213 and 214:
MENDELNET 2013HARDING, F., 1996: Mi
- Page 215 and 216:
MENDELNET 2013INTRODUCTIONEuropean
- Page 217 and 218:
MENDELNET 2013CONCLUSIONSThe aim of
- Page 219 and 220:
MENDELNET 2013INTRODUCTIONFish lipi
- Page 221 and 222:
MENDELNET 2013The effect of fish or
- Page 223 and 224:
MENDELNET 2013COMPARISON OF GRAZING
- Page 225 and 226:
MENDELNET 2013E GQ = Σ(D * FV) / 8
- Page 227 and 228:
MENDELNET 2013CONCLUSIONSAccording
- Page 229 and 230:
MENDELNET 2013INTRODUCTIONThere are
- Page 231 and 232:
MENDELNET 2013thoroughbred horses,
- Page 233 and 234:
MENDELNET 2013Tab. 3 Line-based shi
- Page 235 and 236:
MENDELNET 2013THE EFFECT OF FEEDING
- Page 237 and 238:
MENDELNET 2013Fig. 1 - Digital vill
- Page 239 and 240:
MENDELNET 2013KIDD, M. T., et al.,
- Page 241 and 242:
MENDELNET 2013INTRODUCTIONIn biomed
- Page 243 and 244:
MENDELNET 2013lipid droplets in mat
- Page 245 and 246:
MENDELNET 2013t(%)100ABab0MHCMLCVal
- Page 247 and 248:
MENDELNET 2013HIRAGA, K., HOSHINO,
- Page 249 and 250:
MENDELNET 2013INFLUENCE OF DIETARY
- Page 251 and 252:
MENDELNET 2013Tab. 1 Content of ani
- Page 253 and 254:
MENDELNET 2013THE EFFECT OF BROILER
- Page 255 and 256:
MENDELNET 2013The observation was c
- Page 257 and 258:
MENDELNET 2013incidence of contusio
- Page 259 and 260:
MENDELNET 2013INTRODUCTIONBreeding
- Page 261 and 262:
MENDELNET 2013satisfactory, however
- Page 263 and 264:
MENDELNET 2013ROOTWELT, V., REKSEN,
- Page 265 and 266:
MENDELNET 2013INTRODUCTIONHucul hor
- Page 267 and 268:
MENDELNET 2013• statistically eva
- Page 269 and 270:
MENDELNET 2013REFERENCESDUŠEK, J.
- Page 271 and 272:
MENDELNET 2013INTRODUCTIONIn the la
- Page 273 and 274:
MENDELNET 2013Table 2. Body weight
- Page 275 and 276:
MENDELNET 2013INTERACTIONS BETWEEN
- Page 277 and 278:
MENDELNET 2013Fig. 3: The effect of
- Page 279 and 280:
MENDELNET 2013ŘEZÁČ, P., VIZIOV
- Page 281 and 282:
MENDELNET 2013INTRODUCTIONMilk prod
- Page 283 and 284:
MENDELNET 2013Values of coefficient
- Page 285 and 286:
MENDELNET 2013283 | P age
- Page 287 and 288:
MENDELNET 2013285 | P age
- Page 289 and 290:
MENDELNET 2013INTRODUCTIONSoil hydr
- Page 291 and 292:
MENDELNET 2013Fig. 1 Mineral nitrog
- Page 293 and 294:
MENDELNET 2013DESIGN OF THE EQUIPME
- Page 295 and 296:
MENDELNET 2013These probes were pla
- Page 297 and 298:
MENDELNET 2013CONCLUSIONSOur experi
- Page 299 and 300:
MENDELNET 2013INTRODUCTIONAccelerat
- Page 301 and 302:
MENDELNET 2013The maximum capillary
- Page 303 and 304:
MENDELNET 2013THE INTENSITY OF WATE
- Page 305 and 306:
MENDELNET 2013This paper will addre
- Page 307 and 308:
MENDELNET 2013L-factor was calculat
- Page 309 and 310:
MENDELNET 2013most fertile agricult
- Page 311 and 312:
MENDELNET 2013INTRODUCTIONCarbonate
- Page 313 and 314:
MENDELNET 2013correlated only with
- Page 315 and 316:
MENDELNET 2013PAN, CH., ZHAO, H., Z
- Page 317 and 318:
MENDELNET 2013INTRODUCTIONAgricultu
- Page 319 and 320:
MENDELNET 2013CalciumEvaluationCa m
- Page 321 and 322:
MENDELNET 2013CarbonatesFig. 7: Con
- Page 323 and 324:
MENDELNET 2013ŠKARPA P., 2010: Lab
- Page 325 and 326:
MENDELNET 2013INTRODUCTIONIntercrop
- Page 327 and 328:
MENDELNET 2013Fig. 2 Production of
- Page 329 and 330:
MENDELNET 2013THE POSSIBILITY OF US
- Page 331 and 332:
MENDELNET 2013109. Content of carbo
- Page 333 and 334:
MENDELNET 2013FALLOPIA JAPONICA HOU
- Page 335 and 336:
MENDELNET 2013333 | P age
- Page 337 and 338:
MENDELNET 2013BARNEY, J. N., et al.
- Page 339 and 340:
MENDELNET 2013INTRODUCTIONThis work
- Page 341 and 342:
MENDELNET 2013and higher concentrat
- Page 343 and 344:
MENDELNET 2013A MATHEMATICAL MODEL
- Page 345 and 346:
MENDELNET 2013Coefficients of (1) w
- Page 347 and 348:
MENDELNET 2013CONCLUSIONSAlthough t
- Page 349 and 350:
MENDELNET 2013THE USE OF COMPOST TO
- Page 351 and 352:
MENDELNET 2013Topsoil and subsoil w
- Page 353 and 354:
MENDELNET 2013L. Plošek, J. Elbl,
- Page 355 and 356:
MENDELNET 2013INTRODUCTIONTests of
- Page 357 and 358:
MENDELNET 2013Table 2. Preparation
- Page 359 and 360:
MENDELNET 2013ANALYSIS OF SPRING BA
- Page 361 and 362:
MENDELNET 2013ET. During the growin
- Page 363 and 364:
MENDELNET 2013Evapotranspiration ra
- Page 365 and 366:
MENDELNET 2013INTRODUCTIONThe aim o
- Page 367 and 368:
MENDELNET 2013SOustava“ - Agromet
- Page 369 and 370:
MENDELNET 2013THE HISTORY AND TRADI
- Page 371 and 372:
MENDELNET 2013spol. s.r.o. Monitore
- Page 373 and 374:
MENDELNET 2013ČESKÝ STATISTICKÝ
- Page 375 and 376:
MENDELNET 2013INTRODUCTIONAgricultu
- Page 377 and 378:
MENDELNET 2013• Definition of ele
- Page 379 and 380:
MENDELNET 2013The results are telli
- Page 381 and 382:
MENDELNET 2013DIFFERENCE BETWEEN TH
- Page 383 and 384:
MENDELNET 2013Picture 1 Cadastral V
- Page 385 and 386:
MENDELNET 2013Fig. 1 Degree of eros
- Page 387 and 388:
MENDELNET 2013INTRODUCTIONSoil eros
- Page 389 and 390:
MENDELNET 2013stable forms of organ
- Page 391 and 392:
MENDELNET 2013land use, pesticides,
- Page 393 and 394:
MENDELNET 2013EFFECTS OF UV RADIATI
- Page 395 and 396:
MENDELNET 2013Flysch Godulian sands
- Page 397 and 398:
MENDELNET 2013CONCLUSIONSUV-B radia
- Page 399 and 400:
MENDELNET 2013COMPARISON OF METHODS
- Page 401 and 402:
MENDELNET 2013sum of the detected a
- Page 403 and 404:
MENDELNET 2013same predictive value
- Page 405 and 406:
MENDELNET 2013Section - Rural Devel
- Page 407 and 408:
MENDELNET 2013THE IMPACT OF WINTER
- Page 409 and 410:
MENDELNET 2013accommodation due to
- Page 411 and 412:
MENDELNET 2013THE USE OF SOLAR ENER
- Page 413 and 414:
MENDELNET 2013The general data of t
- Page 415 and 416:
MENDELNET 2013The photovoltaic powe
- Page 417 and 418:
MENDELNET 2013FUNCTION OF AGRICULTU
- Page 419 and 420:
MENDELNET 2013Fig. 1. The definitio
- Page 421 and 422:
MENDELNET 2013EconomicEconomic• E
- Page 423 and 424:
MENDELNET 2013RENEWABLE ENERGY, AS
- Page 425 and 426:
MENDELNET 2013After analysing the d
- Page 427 and 428:
MENDELNET 2013Rural settlements are
- Page 429 and 430:
MENDELNET 2013THE IMPACT OF A ROAD
- Page 431 and 432:
MENDELNET 2013Three types of CES we
- Page 433 and 434:
MENDELNET 2013stream [9] and Kamenn
- Page 435 and 436:
MENDELNET 2013THE PROPOSAL OF LANDS
- Page 437 and 438:
MENDELNET 2013MATERIAL AND METHODST
- Page 439 and 440:
MENDELNET 2013As for our own resear
- Page 441 and 442:
MENDELNET 2013occur more often and
- Page 443 and 444:
MENDELNET 2013The arrangements how
- Page 445 and 446:
MENDELNET 2013Layers of basic mapsQ
- Page 447 and 448:
MENDELNET 2013INTRODUCTIONLand cons
- Page 449 and 450:
MENDELNET 2013reforms, all balks, b
- Page 451 and 452:
MENDELNET 2013ASSESSMENT OF CHANGES
- Page 453 and 454:
MENDELNET 2013meets criteria of sel
- Page 455 and 456:
MENDELNET 2013unutilization. Extens
- Page 457 and 458:
MENDELNET 2013INTRODUCTIONSince joi
- Page 459 and 460:
MENDELNET 2013On the contrary a neg
- Page 461 and 462:
MENDELNET 2013THEORETICAL AND METHO
- Page 463 and 464:
MENDELNET 2013RESULT AND DISCUSSION
- Page 465 and 466:
MENDELNET 2013amount of information
- Page 467 and 468:
MENDELNET 2013IMPLEMENTING THE STAT
- Page 469 and 470:
MENDELNET 2013practice example can
- Page 471 and 472:
MENDELNET 2013elaborating the docum
- Page 473 and 474:
MENDELNET 2013SOUTH-MORAVIAN COUNTR
- Page 475 and 476:
MENDELNET 2013Tab. 1 Number of devi
- Page 477 and 478:
MENDELNET 2013REFERENCES1) ADAMCOV
- Page 479 and 480:
MENDELNET 2013INTRODUCTIONDespite o
- Page 481 and 482:
MENDELNET 2013RESULTS FROM SWOT ANA
- Page 483 and 484:
MENDELNET 2013PRIŠENK, J. and BORE
- Page 485 and 486:
MENDELNET 2013INTRODUCTIONIt has be
- Page 487 and 488:
MENDELNET 2013RESULT AND DISCUSSION
- Page 489 and 490:
MENDELNET 2013THE ECONOMIC AND SOCI
- Page 491 and 492:
MENDELNET 2013citizen (the buyer) i
- Page 493 and 494:
MENDELNET 2013of South Moravian Reg
- Page 495 and 496:
MENDELNET 2013INTRODUCTIONWith the
- Page 497 and 498:
MENDELNET 2013Fig.1. Map of present
- Page 499 and 500:
MENDELNET 2013Fig.2 Hydric potentia
- Page 501 and 502:
MENDELNET 2013EVALUATION OF CURRENT
- Page 503 and 504:
MENDELNET 2013through prepared ques
- Page 505 and 506:
MENDELNET 2013example; it won the s
- Page 507 and 508:
MENDELNET 2013THE DEVELOPMENT AND C
- Page 509 and 510:
MENDELNET 2013countries was evaluat
- Page 511 and 512:
MENDELNET 2013itself. While impleme
- Page 513 and 514:
MENDELNET 2013INTRODUCTIONThe Czech
- Page 515 and 516:
MENDELNET 2013Fig. 3 Map of the Cze
- Page 517 and 518:
MENDELNET 2013CONCLUSIONSProduction
- Page 519 and 520:
MENDELNET 2013INTRODUCTIONLandscape
- Page 521 and 522:
MENDELNET 2013The 3-level planning
- Page 523 and 524:
MENDELNET 2013THE PROPOSAL OF THE W
- Page 525 and 526:
MENDELNET 2013RESULT AND DISCUSSION
- Page 527 and 528:
MENDELNET 2013demonstrates that env
- Page 529 and 530:
MENDELNET 2013INTRODUCTIONLand cons
- Page 531 and 532:
MENDELNET 2013Fig. 2: Reconnaissanc
- Page 533 and 534:
MENDELNET 2013MEASUREMENT OF EMISSI
- Page 535 and 536:
MENDELNET 2013Tab. 1: The range and
- Page 537 and 538:
MENDELNET 2013However, the comparis
- Page 539 and 540:
MENDELNET 2013INDICATORS OF THE QUA
- Page 541 and 542:
MENDELNET 2013Tab. 1 Index of livin
- Page 543 and 544:
MENDELNET 2013CONCLUSIONSResults of
- Page 545 and 546:
MENDELNET 2013INTRODUCTIONTourism d
- Page 547 and 548:
MENDELNET 2013Disadvantages are rep
- Page 549 and 550:
MENDELNET 2013547 | P age
- Page 551 and 552:
MENDELNET 2013549 | P age
- Page 553 and 554:
MENDELNET 2013INTRODUCTIONThe therm
- Page 555 and 556:
MENDELNET 2013RESULT AND DISCUSSION
- Page 557 and 558:
MENDELNET 2013FUSARIUM SPECIES SPEC
- Page 559 and 560:
MENDELNET 2013Table 1: Climatic reg
- Page 561 and 562:
MENDELNET 2013Figure 3: Frequency o
- Page 563 and 564:
MENDELNET 2013IOOS, R. - BELHADJ, S
- Page 565 and 566:
MENDELNET 2013MONITORING OF PHTHALA
- Page 567 and 568:
MENDELNET 2013RESULTS AND DISCUSSIO
- Page 569 and 570:
MENDELNET 2013REFERENCESBRIMER, L.,
- Page 571 and 572:
MENDELNET 2013INTRODUCTIONSmall far
- Page 573 and 574:
MENDELNET 2013Tab. 4: Counts of mic
- Page 575 and 576:
MENDELNET 2013significant, the extr
- Page 577 and 578:
MENDELNET 2013THE USING OF NEAR INF
- Page 579 and 580:
MENDELNET 2013optical probe by 100
- Page 581 and 582:
MENDELNET 2013CONCLUSIONSThe device
- Page 583 and 584:
MENDELNET 2013INTRODUCTIONLipids wi
- Page 585 and 586:
MENDELNET 2013High acid content of
- Page 587 and 588:
MENDELNET 2013DYNAMICS OF CHANGES I
- Page 589 and 590:
MENDELNET 2013The barley crop was h
- Page 591 and 592:
MENDELNET 2013Fig. 5: B-hordeins (%
- Page 593 and 594:
MENDELNET 2013HŘIVNA L., GREGOR T.
- Page 595 and 596:
MENDELNET 2013INTRODUCTIONPhthalic
- Page 597 and 598:
MENDELNET 2013concentrations of DBP
- Page 599 and 600:
MENDELNET 2013YIELD AND QUALITY OF
- Page 601 and 602:
MENDELNET 2013variants is shown in
- Page 603 and 604:
MENDELNET 2013%22,021,020,019,018,0
- Page 605 and 606:
MENDELNET 2013EGGSHELL CRACK DETECT
- Page 607 and 608:
MENDELNET 2013It consists of three
- Page 609 and 610:
MENDELNET 2013magnitude values from
- Page 611 and 612:
MENDELNET 2013ANTIMICROBIAL PROTECT
- Page 613 and 614:
MENDELNET 2013filled by one drop of
- Page 615 and 616:
MENDELNET 2013TRIPATHI, P. AND N.K.
- Page 617 and 618:
MENDELNET 2013INTRODUCTIONWhey or m
- Page 619 and 620:
MENDELNET 2013values of these sampl
- Page 621 and 622:
MENDELNET 2013The microbiological r
- Page 623 and 624:
MENDELNET 2013THE INFLUENCE OF POLY
- Page 625 and 626:
MENDELNET 2013verified by the seque
- Page 627 and 628:
MENDELNET 2013JUMP D.B., 2008: N-3
- Page 629 and 630:
MENDELNET 2013Section - Plant Biolo
- Page 631 and 632:
MENDELNET 2013NON-DESTRUCTIVE ANALY
- Page 633 and 634:
MENDELNET 2013Graph. 1 Content of f
- Page 635 and 636:
MENDELNET 2013CONCLUSIONSThe highes
- Page 637 and 638:
MENDELNET 2013INTRODUCTIONThe occur
- Page 639 and 640:
MENDELNET 2013-2815 Calculated13897
- Page 641 and 642:
MENDELNET 2013EFFECT OF STRIGOLACTO
- Page 643 and 644:
MENDELNET 2013For the assessment of
- Page 645 and 646:
MENDELNET 2013PAPONOV, I. A. TEALE,
- Page 647 and 648:
MENDELNET 2013INTRODUCTIONMilk this
- Page 649 and 650:
MENDELNET 2013CitoniceFRAA8400007 8
- Page 651 and 652:
MENDELNET 2013DETERMINATION OF OIL
- Page 653 and 654:
MENDELNET 2013extraction, the secon
- Page 655 and 656:
MENDELNET 2013The blue curve (upper
- Page 657 and 658:
MENDELNET 2013INTRODUCTIONThe dynam
- Page 659 and 660:
MENDELNET 2013auxin source. These d
- Page 661 and 662:
MENDELNET 2013PREDICTION OF TECHNOL
- Page 663 and 664:
MENDELNET 2013Total volume of PCR r
- Page 665 and 666:
MENDELNET 2013DONG, H., COX, T. S.,
- Page 667 and 668:
MENDELNET 2013INTRODUCTIONCereals a
- Page 669 and 670:
MENDELNET 2013demonstrated in genot
- Page 671 and 672:
MENDELNET 2013INTERACTIVE EFFECTS O
- Page 673 and 674:
MENDELNET 2013number) were performe
- Page 675 and 676:
MENDELNET 2013CONCLUSIONSElevated [
- Page 677 and 678:
MENDELNET 2013INTRODUCTIONAnthocyan
- Page 679 and 680:
MENDELNET 2013possible that a copy
- Page 681 and 682:
MENDELNET 2013INTRODUCTIONBesides t
- Page 683 and 684:
MENDELNET 2013DFR expressionThe exp
- Page 685 and 686:
MENDELNET 2013683 | P age
- Page 687 and 688:
MENDELNET 2013685 | P age
- Page 689 and 690:
MENDELNET 2013INTRODUCTIONThe under
- Page 691 and 692:
MENDELNET 2013Tab. 3 The results of
- Page 693 and 694:
MENDELNET 2013REAL-TIME SENSING OF
- Page 695 and 696:
MENDELNET 2013Heart preparationFirs
- Page 697 and 698:
MENDELNET 2013Li, L., T. L. M. ten
- Page 699 and 700:
MENDELNET 2013INTRODUCTIONBirds are
- Page 701 and 702:
MENDELNET 2013CONCLUSIONSThis work
- Page 703 and 704:
MENDELNET 2013THE EFFECT OF MOLYBDE
- Page 705 and 706:
MENDELNET 2013statistical program S
- Page 707 and 708:
MENDELNET 2013REFERENCESBERSÉNYI,A
- Page 709 and 710:
MENDELNET 2013INTRODUCTIONIn compar
- Page 711 and 712:
MENDELNET 2013Flight activity of do
- Page 713 and 714:
MENDELNET 2013ARACHNOFAUNA OF TREES
- Page 715 and 716:
MENDELNET 2013Fig. 2: Distribution
- Page 717 and 718:
MENDELNET 2013MILLER F., 1971: Řá
- Page 719 and 720:
MENDELNET 2013INTRODUCTIONThe way o
- Page 721 and 722:
MENDELNET 2013Calathus micropterus
- Page 723 and 724:
MENDELNET 2013HOW ABOUT EATING THE
- Page 725 and 726:
MENDELNET 2013In the first analyse
- Page 727 and 728:
MENDELNET 2013MARKOVÁ, Z. a HEJDA,
- Page 729 and 730:
MENDELNET 2013INTRODUCTIONAll horse
- Page 731 and 732:
MENDELNET 2013phenotypically as dar
- Page 733 and 734:
MENDELNET 2013underwhite Gene (uw)U
- Page 735 and 736:
MENDELNET 2013INTRODUCTIONMeat qual
- Page 737 and 738:
MENDELNET 2013The substitution C878
- Page 739 and 740:
MENDELNET 2013ICHTHYOLOGICAL SURVEY
- Page 741 and 742:
MENDELNET 2013RESULT AND DISCUSSION
- Page 743 and 744:
MENDELNET 2013the mostly balanced f
- Page 745 and 746:
MENDELNET 2013THE EFFECT OF HEAVY M
- Page 747 and 748:
MENDELNET 201324 h on a shaker at 4
- Page 749 and 750:
MENDELNET 2013Elased, K. M., T. S.
- Page 751 and 752:
MENDELNET 2013INTRODUCTIONRecently,
- Page 753 and 754:
MENDELNET 2013caudal fin is needed
- Page 755 and 756:
MENDELNET 20133D CHIP AS A TOOL FOR
- Page 757 and 758:
MENDELNET 2013Fabrication of 3D mic
- Page 759 and 760:
MENDELNET 2013CONCLUSIONSWe describ
- Page 761 and 762:
MENDELNET 2013INTRODUCTIONSeveral f
- Page 763 and 764:
MENDELNET 2013Tab.3: Absolute and r
- Page 765 and 766:
MENDELNET 2013loci on Sus scrofa ch
- Page 767 and 768:
MENDELNET 2013INTRODUCTIONThe dog i
- Page 769 and 770:
MENDELNET 2013Fig. 1 The negative c
- Page 771 and 772:
MENDELNET 2013ECOLOGY AND HABITAT P
- Page 773 and 774:
MENDELNET 2013specimens. Data on th
- Page 775 and 776:
MENDELNET 2013CONCLUSIONSThe evalua
- Page 777 and 778:
MENDELNET 2013INTRODUCTIONIt is nec
- Page 779 and 780:
MENDELNET 2013Fig. 2: Nucleus movin
- Page 781 and 782:
MENDELNET 2013distance comparing to
- Page 783 and 784:
MENDELNET 2013INTRODUCTIONThe count
- Page 785 and 786:
MENDELNET 2013Tab .2LocalityVyšavy
- Page 787 and 788:
MENDELNET 2013Tab. 4LocalityNosisla
- Page 789 and 790:
MENDELNET 2013REFERENCESBrychta, V.
- Page 791 and 792:
MENDELNET 2013INTRODUCTIONMammary g
- Page 793 and 794:
MENDELNET 2013Fig. 2. Proportion of
- Page 795 and 796:
MENDELNET 2013THE FOOD OF PERCH (PE
- Page 797 and 798:
MENDELNET 2013Cladocerans were domi
- Page 799 and 800:
MENDELNET 2013PETERKA, J., MATĚNA,
- Page 801 and 802:
MENDELNET 2013INTRODUCTIONFrom a pe
- Page 803 and 804:
MENDELNET 2013REFERENCESDIENER, S.,
- Page 805 and 806:
MENDELNET 2013Section - Techniques
- Page 807 and 808:
MENDELNET 2013EVALUATION OF POLLUTI
- Page 809 and 810:
MENDELNET 2013relief valve into the
- Page 811 and 812:
MENDELNET 2013the end of laboratory
- Page 813 and 814:
MENDELNET 2013INTRODUCTIONAgricultu
- Page 815 and 816:
MENDELNET 2013CONCLUSIONSFig. 1 Box
- Page 817 and 818:
MENDELNET 2013CONCEPTUAL SOLUTION O
- Page 819 and 820:
MENDELNET 2013Chemical parameters:
- Page 821 and 822:
MENDELNET 2013Focusing on the econo
- Page 823 and 824:
MENDELNET 2013INTRODUCTIONHigher de
- Page 825 and 826:
MENDELNET 2013RESULT AND DISCUSSION
- Page 827 and 828:
MENDELNET 2013REFERENCESBAUER, F.,
- Page 829 and 830:
MENDELNET 2013INTRODUCTIONToday´s
- Page 831 and 832:
MENDELNET 2013Fig. 1 - Embedded sys
- Page 833 and 834:
MENDELNET 2013From the above it is
- Page 835 and 836:
MENDELNET 2013INTRODUCTIONNowadays,
- Page 837 and 838:
MENDELNET 2013Fig. 1. The average n
- Page 839 and 840:
MENDELNET 2013LABORATORY MEASUREMEN
- Page 841 and 842:
MENDELNET 2013Electronic thermomete
- Page 843 and 844:
MENDELNET 2013Fig. 3 Graph of depen
- Page 845 and 846:
MENDELNET 2013INTRODUCTIONThe devel
- Page 847 and 848:
MENDELNET 2013Graph no. 2 represent
- Page 849 and 850:
MENDELNET 2013ANALYSIS OF MODERN ME
- Page 851 and 852: MENDELNET 2013CMT welding systemCMT
- Page 853 and 854: MENDELNET 2013SampleTab. 2 Overview
- Page 855 and 856: MENDELNET 2013INTRODUCTIONCarbon di
- Page 857 and 858: MENDELNET 2013fan power is performe
- Page 859 and 860: MENDELNET 2013TRACTOR ENGINE MODES
- Page 861 and 862: MENDELNET 2013Technical parameters
- Page 863 and 864: MENDELNET 2013Measurement confirmed
- Page 865 and 866: MENDELNET 2013INTRODUCTIONMain natu
- Page 867 and 868: MENDELNET 2013Fig. 2 - Sub-region t
- Page 869 and 870: MENDELNET 2013DEVELOPMENT OF SEEDER
- Page 871 and 872: MENDELNET 2013RESULTS AND DISCUSSIO
- Page 873 and 874: MENDELNET 2013The depth controlling
- Page 875 and 876: MENDELNET 2013INTRODUCTIONInfluence
- Page 877 and 878: MENDELNET 2013In graph 1 is the sma
- Page 879 and 880: MENDELNET 2013DESIGN OF A MONITORIN
- Page 881 and 882: MENDELNET 2013Selection of such typ
- Page 883 and 884: MENDELNET 2013REFERENCESVITÁZEK, I
- Page 885 and 886: MENDELNET 2013INTRODUCTIONFertilisa
- Page 887 and 888: MENDELNET 2013particle-size distrib
- Page 889 and 890: MENDELNET 2013ŠIMA, T. & DUBEŇOV
- Page 891 and 892: MENDELNET 2013INTRODUCTIONBee hive
- Page 893 and 894: MENDELNET 2013RMSmV1601401201008060
- Page 895 and 896: MENDELNET 2013UTILISATION OF PROGRA
- Page 897 and 898: MENDELNET 2013Ivan (1989) stated th
- Page 899 and 900: MENDELNET 2013Fig. 4 Manoeuvre - ri
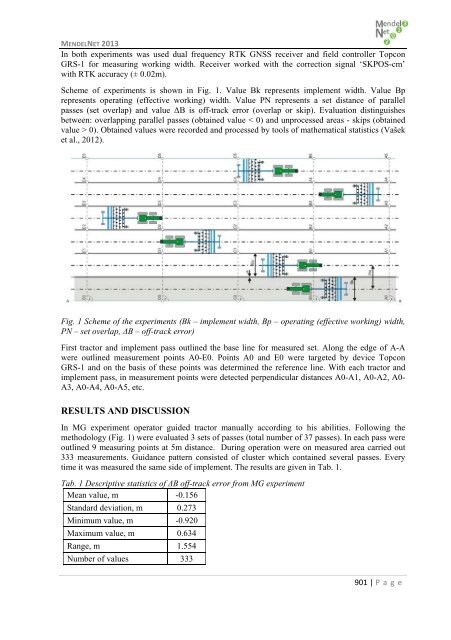
- Page 901: MENDELNET 2013EFFECT OF THE SATELLI
- Page 905 and 906: MENDELNET 2013operation 125 measure
- Page 907 and 908: MENDELNET 2013905 | P age
- Page 909 and 910: MENDELNET 2013907 | P age
- Page 911 and 912: MENDELNET 2013INTRODUCTIONTheranost
- Page 913 and 914: MENDELNET 2013Fig. 1 Characterizati
- Page 915 and 916: MENDELNET 2013LIPOSOMES AS DRUG CAR
- Page 917 and 918: MENDELNET 2013microplate in various
- Page 919 and 920: MENDELNET 2013Fig. 3: Differential
- Page 921 and 922: MENDELNET 2013THE ROLE OF NITRIC OX
- Page 923 and 924: MENDELNET 2013one such compound bec
- Page 925 and 926: MENDELNET 2013Kováčik, J., Klejdu
- Page 927 and 928: MENDELNET 2013INTRODUCTIONWater is
- Page 929 and 930: MENDELNET 2013For all the heavy met
- Page 931 and 932: MENDELNET 2013THE USE OF NANOTECHNO
- Page 933 and 934: MENDELNET 2013During the analysis 2
- Page 935 and 936: MENDELNET 2013REFERENCES[1] RANDALL
- Page 937 and 938: MENDELNET 2013INTRODUCTIONQuantum d
- Page 939 and 940: MENDELNET 2013Fig. 2: The staining
- Page 941 and 942: MENDELNET 2013REFERENCESAlgar, W. R
- Page 943 and 944: MENDELNET 2013INTRODUCTIONGunshot r
- Page 945 and 946: MENDELNET 2013correlation is seen b
- Page 947 and 948: MENDELNET 2013ELECTROCHEMICAL DETEC
- Page 949 and 950: MENDELNET 2013Electrochemical detec
- Page 951 and 952: MENDELNET 2013Krizkova, S., I. Fabr
- Page 953 and 954:
MENDELNET 2013HavlováL.721 Kadlč
- Page 955 and 956:
MENDELNET 2013Procházková B. 48
- Page 957:
MENDELNET 2013Name of publication: