- Page 1:
THE CHANGING FACE OF
- Page 4 and 5:
All material contained in this repo
- Page 6 and 7:
AcknowledgmentsU.S. Department of T
- Page 9 and 10:
Table of ContentsChapter 1—Vision
- Page 11:
Chapter 6—Technology ............
- Page 14 and 15:
change. Secretary Slater challenged
- Page 16 and 17:
A Chronology of Vision and Vigilanc
- Page 18 and 19:
January 1999New Rule Revising USDOT
- Page 20 and 21:
Table 1-1Forecasts Past and Future1
- Page 22 and 23:
Technology has played a critical ro
- Page 24 and 25:
Today, highway vehicle-miles travel
- Page 26 and 27:
conventional classroom with the adv
- Page 28 and 29:
than predicted. The large differenc
- Page 30 and 31:
In 1975, the nation saw nearly 50,0
- Page 32 and 33:
FAA and NASA: Working Together on A
- Page 34 and 35:
traffic and more time with families
- Page 36 and 37:
operations, maintenance, and mannin
- Page 38 and 39:
EnergyIn 1975, the United States co
- Page 40 and 41:
General Motors has manufacturing fa
- Page 42 and 43:
immigration and drug smuggling by s
- Page 44 and 45:
This report is organized around six
- Page 47:
chapter 2Growth, Deregulation,and I
- Page 50 and 51:
Figure 2-2Economic Growth in the Un
- Page 52 and 53:
Growth of the Transportation System
- Page 54 and 55:
Figure 2-6Vehicle-Miles Traveled on
- Page 56 and 57:
Box 2-1ISTEA/TEA-21The Intermodal S
- Page 58 and 59:
Box 2-3TelecommutingEmerging techno
- Page 60 and 61:
Figure 2-11Urban Rail Systems in th
- Page 62 and 63:
Figure 2-12Transit Ridership: 1975-
- Page 64 and 65:
the Gulf Coast Corridor, New York
- Page 66 and 67:
Air Traffic Performance-Based Organ
- Page 68 and 69:
Figure 2-17U.S. Domestic and Intern
- Page 70 and 71:
Box 2-6Higher Profits for U.S. Airl
- Page 72 and 73:
Figure 2-21Regional/Commuter Passen
- Page 74 and 75:
Figure 2-24Fixed-Wing Piston Aircra
- Page 76 and 77:
The FAA, in cooperationwith NASA, i
- Page 78 and 79:
LaunchesIn 1999, narrow-body aircra
- Page 80 and 81:
Millions of short tonsFigure 2-34U.
- Page 82 and 83:
Table 2-1U.S. Oceangoing Merchant M
- Page 84 and 85:
Figure 2-39Top 25 U.S. Container Po
- Page 86 and 87:
Figure 2-41U.S. Total Waterborne Co
- Page 88 and 89:
Significant deregulation legislatio
- Page 90 and 91:
the curtailed service in rural area
- Page 92 and 93:
Figure 2-45Railroad Network Showing
- Page 94 and 95:
direct flights to destinations and
- Page 96 and 97:
Figure 2-47International and Domest
- Page 98 and 99:
asis between shippers and carriers.
- Page 100 and 101:
Figure 2-48Total Ton-Miles of Freig
- Page 102 and 103:
Japan and Korea are still our major
- Page 104 and 105:
This shift from a “push” to a
- Page 106 and 107:
We may have to consider workforce-r
- Page 108 and 109:
Logistics Management and Distributi
- Page 111:
chapter 3Safety“ There is need fo
- Page 114 and 115:
Figure 3-1Total Fatalities in All M
- Page 116 and 117:
7. do a better job of data collecti
- Page 118 and 119:
The USDOT human factors research in
- Page 120 and 121:
Figure 3-4Total Traffic Fatalities:
- Page 122 and 123:
Vehicle Rollover and Size Compatibi
- Page 124 and 125:
Box 3-2Pedestrian and Bicycle Trips
- Page 126 and 127:
Figure 3-9Alcohol-Related Traffic F
- Page 128 and 129:
Under TEA-21, some portion of feder
- Page 130 and 131:
Child Restraints: Standards for chi
- Page 132 and 133: Demographic Characteristics (age)In
- Page 134 and 135: Figure 3-18Crash Rate per 100,000 L
- Page 136 and 137: Road CharacteristicsSafer Roads: Si
- Page 138 and 139: Together, these systems provide an
- Page 140 and 141: Automation of enforcement efforts
- Page 142 and 143: By the mid-1980s, with deregulation
- Page 144 and 145: Transit SafetyIn 1975, transit, lik
- Page 146 and 147: Figure 3-28Total Train Incidents: 1
- Page 148 and 149: Figure 3-31Rail-Related Fatality Ra
- Page 150 and 151: Figure 3-34Number of Highway-Rail G
- Page 152 and 153: Figure 3-35Fatal Commercial Air Tra
- Page 154 and 155: In the early 1970s, the aviation in
- Page 156 and 157: The program was enhanced by an agre
- Page 158 and 159: Box 3-10 continued2,000 older, larg
- Page 160 and 161: Figure 3-41Recreational Boating Acc
- Page 162 and 163: systems for steering andmachinery m
- Page 164 and 165: In addition to search and rescue ac
- Page 166 and 167: communities with access to the info
- Page 168 and 169: are growing. Smart pigs will be inc
- Page 170 and 171: Regulations are issued by the USDOT
- Page 172 and 173: Keys to the FutureA number of curre
- Page 174 and 175: References23 CFR Part 1313. U.S. De
- Page 176 and 177: U.S. Department of Transportation (
- Page 178 and 179: _____. 2000c. Office of Investigati
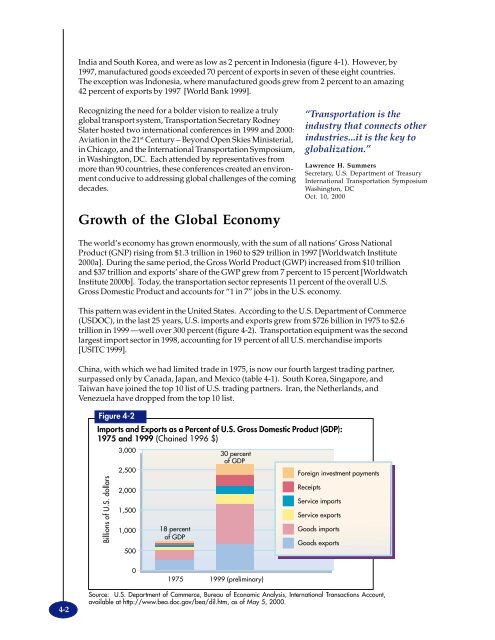
- Page 181: GlobalizationIn the last quarter-ce
- Page 185 and 186: Figure 4-4Foreign Direct Investment
- Page 187 and 188: Mitsubishi Motor Sales of America,
- Page 189 and 190: Table 4-4“Domestic” Vehicles Bu
- Page 191 and 192: Table 4-5Top Selling Cars and Truck
- Page 193 and 194: The European Union (EU) achieved fu
- Page 195 and 196: Figure 4-6Open Skies Agreements wit
- Page 197 and 198: Figure 4-8Foreign Residents Visitin
- Page 199 and 200: The record growth of world travel h
- Page 201 and 202: Figure 4-11Hull Loss Accident Rates
- Page 203 and 204: integrated air and truck service. A
- Page 205 and 206: traffic, will likely result in the
- Page 207 and 208: Figure 4-18World Shipping Deliverie
- Page 209 and 210: The world merchant fleet in 1975 co
- Page 211 and 212: By 2025, U.S. ports must be prepare
- Page 213 and 214: Figure 4-26Merchandise Exports to C
- Page 215 and 216: through Laredo, Texas, increased 24
- Page 217 and 218: approved for partnerships that woul
- Page 219 and 220: Japan Automobile Manufacturers Asso
- Page 221: U.S. Department of Transportation (
- Page 225 and 226: chapter 5People, Energy, andthe Env
- Page 227 and 228: Table 5-1Population and Passenger T
- Page 229 and 230: carpools are now really family acti
- Page 231 and 232: Figure 5-5Household Vehicle Ownersh
- Page 233 and 234:
Figure 5-8Commuting Flow: 1960-9045
- Page 235 and 236:
Box 5-2Access to Transportation for
- Page 237 and 238:
Figure 5-12Mode of Transportation b
- Page 239 and 240:
Figure 5-16Long-Distance Trip Makin
- Page 241 and 242:
Figure 5-18Estimated Percentage of
- Page 243 and 244:
transportation’s share of U.S. pe
- Page 245 and 246:
Figure 5-21Changes in the Energy In
- Page 247 and 248:
loss to the U.S. economy is equal t
- Page 249 and 250:
States’ gas hydrate resources alo
- Page 251 and 252:
Box 5-4Environmental JusticeCommuni
- Page 253 and 254:
Despite dramatic reductions in air
- Page 255 and 256:
Figure 5-27Particulate Emissions: 1
- Page 257 and 258:
cleaner industrial and electrical g
- Page 259 and 260:
Because transportation greenhouse g
- Page 261 and 262:
Other fuels show less promise at th
- Page 263 and 264:
The advent of increased environment
- Page 265 and 266:
eduction programs will be highly su
- Page 267 and 268:
A 1980s study estimated that 37 per
- Page 269 and 270:
and if we remain vigilant, we could
- Page 271 and 272:
Invasive Species: Transportation in
- Page 273 and 274:
Box 5-11Clinton-Gore Livable Commun
- Page 275 and 276:
Organization for Economic Cooperati
- Page 277:
_____. 2000a. National Air Quality
- Page 281 and 282:
chapter 6TechnologyDramatic develop
- Page 283 and 284:
U.S. and Allied forces with accurat
- Page 285 and 286:
the base station to monitor the ent
- Page 287 and 288:
The roots of ITS predate the establ
- Page 289 and 290:
Figure 6-36-16Projected The Largest
- Page 291 and 292:
Figure 6-4Deployment of Traffic Sig
- Page 293 and 294:
payment systems becomeintegrated wi
- Page 295 and 296:
Collision Avoidance and Warning Sys
- Page 297 and 298:
Computer dispatched paratransit veh
- Page 299 and 300:
Box 6-5Types of High-Speed Ground T
- Page 301 and 302:
Figure 6-16 6-10Projected Growth in
- Page 303 and 304:
Box 6-6 continuedIntelligent Railro
- Page 305 and 306:
military, and general aviation) to
- Page 307 and 308:
(“independent”) radars and seco
- Page 309 and 310:
USDOT, FAAUsing the Enhanced Traffi
- Page 311 and 312:
national deployment and as users eq
- Page 313 and 314:
Airport complexes (Reagan National,
- Page 315 and 316:
The methods used to gather and dist
- Page 317 and 318:
commodities, but intelligent contro
- Page 319:
chapter 7National Security“In the
- Page 322 and 323:
The nation’s ability to meet the
- Page 324 and 325:
Figure 7-1National Defense Reserve
- Page 326 and 327:
The Strategic Highway Network (STRA
- Page 328 and 329:
Figure 7-4Worldwide International T
- Page 330 and 331:
Figure 7-9Terrorist Attacks Against
- Page 332 and 333:
These acts of piracy accounted for
- Page 334 and 335:
Keys to the FutureTerrorism is a gr
- Page 336 and 337:
Box 7-2Aviation Security TrainingPr
- Page 338 and 339:
threat in the mid-1970s—the gover
- Page 340 and 341:
Threats to Maritime SecurityOur Nat
- Page 342 and 343:
Latin America and the Carribean Bas
- Page 344 and 345:
______. 1999. America’s Merchant
- Page 346 and 347:
Figure 2-41 U.S. Total Waterborne C
- Page 348 and 349:
Figure 5-1 Dependence Ratio: 1950-2
- Page 351 and 352:
appendix BAcronyms and Initialisms3
- Page 353 and 354:
LCDLEOLNGLPGLTLLTVsMaglevMARADMERCO
- Page 355 and 356:
appendix CGlossaryAir control facil
- Page 357 and 358:
Commuter air carrier: A small certi
- Page 359 and 360:
Geostationary orbit: Any orbit at a
- Page 361 and 362:
Loran: An electronic navigational s
- Page 363 and 364:
Seat-miles: The aircraft-miles flow
- Page 365:
Vessel feeder services: Cargo to/fr