TABLE 3 RESEARCH APPLICATIONS AND AWARDS BY SCHOOL (100% PROJECT VALUE) EDINBURGH RESEARCH AND INNOVATION LIMITED RESEARCH AND COMMERCIALISATION REPORT FOR THE 9 MONTHS TO 30 APRIL 2012 APPLICATIONS Current Year Previous Year Month YTD Month YTD Full Year YTD Variance Number Value £'000 Number Value £'000 Number Value £'000 Number Value £'000 Number Value £'000 Number Value Arts, Culture and Environment - - - - 1 4,783 42 8,372 55 10,164 (100%) (100%) Business School 2 3 15 1,537 - - 11 1,195 16 2,321 36% 29% Divinity - - 22 3,895 2 155 22 1,598 24 1,607 0% 144% Economics - - 1 21 - - 4 196 5 266 (75%) (89%) <strong>Edinburgh</strong> College <strong>of</strong> Art 3 9 63 6,941 - - - - - - Health in Social Science 3 330 27 5,691 - - 16 2,299 28 4,262 69% 148% History, Classics and Archaeology 7 499 46 4,349 8 1,416 63 6,684 73 8,130 (27%) (35%) Law - - 31 15,368 5 455 29 2,914 32 3,659 7% 427% Literatures, Languages and Cultures 7 2,093 50 7,197 2 1,118 60 5,071 67 6,086 (17%) 42% Moray House School <strong>of</strong> Education 4 146 40 4,343 4 1,103 42 5,208 54 6,401 (5%) (17%) Philosophy, Psychology and Language Sciences 10 2,288 70 20,715 4 681 75 11,471 86 16,936 (7%) 81% Social and Political Science 8 2,505 95 24,411 7 1,823 117 25,235 140 29,581 (19%) (3%) TOTAL CHSS 44 7,873 460 94,468 33 11,534 481 70,243 580 89,413 (4%) 34% - - - - - - - - - - Biomedical Sciences 10 2,303 69 21,308 6 10,554 75 37,245 99 47,252 (8%) (43%) Clinical Sciences and Community Health 38 21,278 279 130,440 22 4,336 248 73,646 320 99,482 13% 77% Molecular and Clinical Medicine 20 14,000 171 91,032 20 6,697 128 66,137 159 84,372 34% 38% Royal (Dick) School <strong>of</strong> Veterinary Studies 14 6,986 106 31,909 15 1,576 100 26,272 135 35,118 6% 21% TOTAL CMVM 82 44,567 625 274,689 63 23,163 551 203,300 713 266,224 13% 35% - - - - - - - - - - Biological Sciences 15 4,056 139 82,342 8 5,994 153 92,724 194 109,533 (9%) (11%) Chemistry 4 3,884 51 28,582 2 864 66 28,094 80 30,671 (23%) 2% Engineering 11 1,785 106 56,383 9 11,162 101 51,956 126 60,843 5% 9% Geosciences 6 232 105 32,841 4 101 131 27,564 162 33,480 (20%) 19% In<strong>for</strong>matics 15 6,760 87 38,060 4 796 99 58,095 123 68,061 (12%) (34%) Mathematics 2 232 25 10,764 4 142 40 13,957 43 16,212 (38%) (23%) College General - - 3 1,469 - - - - - - - - Physics 5 11,623 88 71,393 5 513 106 53,296 120 60,825 (17%) 34% TOTAL CSE 58 28,572 604 321,834 36 19,572 696 325,686 848 379,625 (13%) (1%) - - - - - - - - - - Support Services 3 170 6 2,301 1 96 15 1,020 19 1,284 (60%) 126% - - - - - - - - - - Grand Total 187 81,182 1,695 693,292 133 54,365 1,743 600,249 2,160 736,546 (3%) 16% - - - - - - - - - - AWARDS Current Year Previous Year Month YTD Month YTD Full Year YTD Variance Number Value £'000 Number Value £'000 Number Value £'000 Number Value £'000 Number Value £'000 Number Value Arts, Culture and Environment - - - - - - 13 344 16 465 (100%) (100%) Business School 1 18 6 62 - - 8 203 11 235 (25%) (69%) Divinity 1 22 2 72 - - 8 983 13 1,302 (75%) (93%) Economics - - 1 70 - - 1 2 1 2 0% 3400% <strong>Edinburgh</strong> College <strong>of</strong> Art 4 16 33 3,684 - - - - - - Health in Social Science - - 7 499 - - 3 76 5 249 133% 557% History, Classics and Archaeology 3 1,098 21 2,542 4 214 18 356 23 519 17% 614% Law 1 15 13 235 1 27 5 65 9 392 160% 262% Literatures, Languages and Cultures 2 10 14 1,529 1 1 19 1,779 29 1,871 (26%) (14%) Moray House School <strong>of</strong> Education 2 26 19 2,194 1 24 18 896 22 1,340 6% 145% Philosophy, Psychology and Language Sciences 2 35 12 201 1 418 18 1,604 31 6,581 (33%) (87%) Social and Political Science 5 262 40 2,180 3 796 16 2,388 24 4,441 150% (9%) TOTAL CHSS 21 1,502 168 13,268 11 1,480 127 8,696 184 17,397 32% 53% - - - - - - - - - - Biomedical Sciences 4 434 25 4,997 1 2 27 4,954 43 9,547 (7%) 1% Clinical Sciences and Community Health 6 1,114 122 31,009 7 2,710 102 17,182 150 23,425 20% 80% Molecular and Clinical Medicine 58 6,238 172 29,769 4 710 44 10,890 70 17,444 291% 173% Royal (Dick) School <strong>of</strong> Veterinary Studies 3 598 51 5,848 14 1,789 43 7,343 65 11,993 19% (20%) TOTAL CMVM 71 8,384 370 71,623 26 5,211 216 40,369 328 62,409 71% 77% - - - - - - - - - - Biological Sciences 8 1,702 66 22,121 5 5,370 57 24,648 79 38,036 16% (10%) Chemistry 3 258 18 1,731 1 34 35 4,714 49 8,256 (49%) (63%) Engineering 7 4,230 55 25,467 4 942 42 11,245 58 14,413 31% 126% Geosciences 6 330 63 10,299 8 626 75 9,524 94 12,280 (16%) 8% In<strong>for</strong>matics 5 582 50 8,000 2 23 33 10,338 46 20,155 52% (23%) Mathematics - - 6 737 - - 8 1,529 13 2,200 (25%) (52%) College General - - 2 777 - - - - - - - - Physics 4 11,438 38 37,222 9 2,750 32 5,888 50 7,841 19% 532% TOTAL CSE 33 18,540 298 106,354 29 9,745 282 67,886 389 103,181 6% 57% - - - - - - - - - - Support Services - - 4 272 1 114 4 352 6 367 0% (23%) - - - - - - - - - - Grand Total 125 28,426 840 191,517 67 16,550 629 117,303 907 183,354 34% 63% 10 ALL APPLICATION AND AWARD VALUES ARE 100% PROJECT COSTS 14/05/2012 11:45
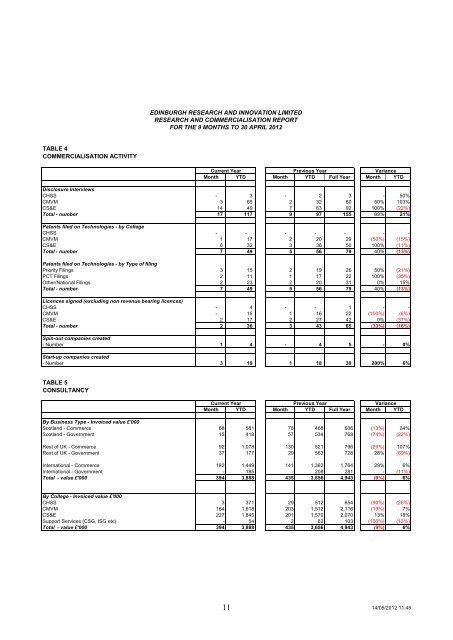
EDINBURGH RESEARCH AND INNOVATION LIMITED RESEARCH AND COMMERCIALISATION REPORT FOR THE 9 MONTHS TO 30 APRIL 2012 TABLE 4 COMMERCIALISATION ACTIVITY Current Year Previous Year Variance Month YTD Month YTD Full Year Month YTD Disclosure Interviews CHSS - 3 - 2 3 - 50% CMVM 3 65 2 32 60 50% 103% CS&E 14 49 7 63 92 100% (22%) Total - number 17 117 9 97 155 89% 21% Patents filed on Technologies - by College CHSS - - - - - - - CMVM 1 17 2 20 29 (50%) (15%) CS&E 6 32 3 36 50 100% (11%) Total - number 7 49 5 56 79 40% (13%) Patents filed on Technologies - by Type <strong>of</strong> filing Priority Filings 3 15 2 19 26 50% (21%) PCT Filings 2 11 1 17 22 100% (35%) Other/National Filings 2 23 2 20 31 0% 15% Total - number 7 49 5 56 79 40% (13%) Licences signed (excluding non revenue bearing licences) CHSS - 4 - - 1 - - CMVM - 15 1 16 22 (100%) (6%) CS&E 2 17 2 27 42 0% (37%) Total - number 2 36 3 43 65 (33%) (16%) Spin-out companies created - Number 1 4 - 4 5 - 0% Start-up companies created - Number 3 19 1 18 30 200% 6% TABLE 5 CONSULTANCY Current Year Previous Year Variance Month YTD Month YTD Full Year Month YTD By Business Type - Invoiced value £'000 Scotland - Commerce 68 581 78 468 606 (13%) 24% Scotland - Government 15 418 57 534 768 (74%) (22%) Rest <strong>of</strong> UK - Commerce 92 1,078 130 521 796 (29%) 107% Rest <strong>of</strong> UK - Government 37 177 29 563 728 28% (69%) International - Commerce 182 1,449 141 1,362 1,764 29% 6% International - Government - 185 - 208 281 - (11%) Total - value £'000 394 3,888 435 3,656 4,943 (9%) 6% By College - Invoiced value £'000 CHSS 3 371 29 512 654 (90%) (28%) CMVM 164 1,618 203 1,512 2,116 (19%) 7% CS&E 227 1,845 201 1,570 2,070 13% 18% Support Services (CSG, ISG etc) - 54 2 62 103 (100%) (13%) Total - value £'000 394 3,888 435 3,656 4,943 (9%) 6% 11 14/05/2012 11:45