- Page 1 and 2: DEPARTMENT OF CORRECTIONAL SERVICES
- Page 3 and 4: DEPARTMENT OF CORRECTIONAL SERVICES
- Page 5 and 6: Glossary ABS Australian Bureau of S
- Page 7 and 8: INTRODUCTION THE YEAR IN REVIEW BY
- Page 9 and 10: INTRODUCTION Highlights for 2015-16
- Page 11 and 12: INTRODUCTION Strategic Issues for 2
- Page 13 and 14: OUTPUTS AND PERFORMANCE PERFORMANCE
- Page 15 and 16: OUR ORGANISATION Executive Leadersh
- Page 17 and 18: OUR ORGANISATION ROS LAGUE Executiv
- Page 19 and 20: OUR ORGANISATION AMANDA NOBBS-CARCU
- Page 21 and 22: OUR ORGANISATION Custodial Operatio
- Page 23 and 24: OUR ORGANISATION Statutory Offices
- Page 25 and 26: OUR ORGANISATION Correctional Indus
- Page 27 and 28: OUR ORGANISATION DEPARTMENT OF CORR
- Page 29 and 30: OUR ORGANISATION Legislative Framew
- Page 31 and 32: OUR ORGANISATION Risk Management Fr
- Page 33 and 34: OUR ORGANISATION Stakeholder engage
- Page 35 and 36: PERFORMANCE, ACHIEVEMENTS AND OUTCO
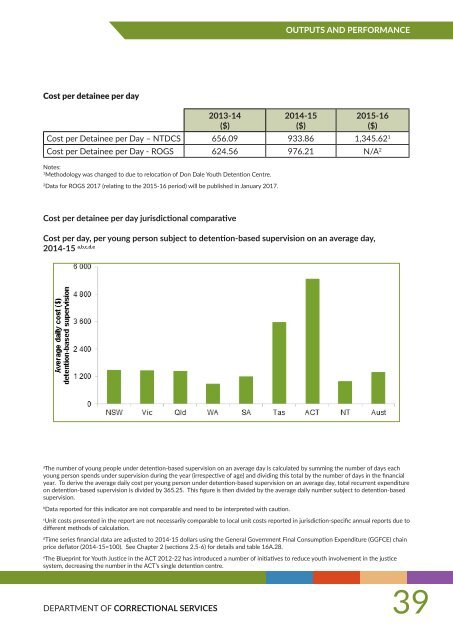
- Page 37: OUTPUTS AND PERFORMANCE • During
- Page 41 and 42: OUTPUTS AND PERFORMANCE Recidivism
- Page 43 and 44: OUTPUTS AND PERFORMANCE Escapes and
- Page 45 and 46: OUTPUTS AND PERFORMANCE Official Vi
- Page 47 and 48: OUTPUTS AND PERFORMANCE Output Grou
- Page 49 and 50: OUTPUTS AND PERFORMANCE Output Grou
- Page 51 and 52: OUTPUTS AND PERFORMANCE Output Grou
- Page 53 and 54: OUTPUTS AND PERFORMANCE Output Grou
- Page 55 and 56: OUTPUTS AND PERFORMANCE Youth Boot
- Page 57 and 58: OUTPUTS AND PERFORMANCE Output Grou
- Page 59 and 60: PERFORMANCE, ACHIEVEMENTS AND OUTCO
- Page 61 and 62: PERFORMANCE, ACHIEVEMENTS AND OUTCO
- Page 63 and 64: PERFORMANCE, ACHIEVEMENTS AND OUTCO
- Page 65 and 66: PERFORMANCE, ACHIEVEMENTS AND OUTCO
- Page 67 and 68: PERFORMANCE, ACHIEVEMENTS AND OUTCO
- Page 69 and 70: PERFORMANCE, ACHIEVEMENTS AND OUTCO
- Page 71 and 72: PERFORMANCE, ACHIEVEMENTS AND OUTCO
- Page 73 and 74: PERFORMANCE, ACHIEVEMENTS AND OUTCO
- Page 75 and 76: PERFORMANCE, ACHIEVEMENTS AND OUTCO
- Page 77 and 78: PERFORMANCE, ACHIEVEMENTS AND OUTCO
- Page 79 and 80: PERFORMANCE, ACHIEVEMENTS AND OUTCO
- Page 81 and 82: PERFORMANCE, ACHIEVEMENTS AND OUTCO
- Page 83 and 84: PERFORMANCE, ACHIEVEMENTS AND OUTCO
- Page 85 and 86: PERFORMANCE, ACHIEVEMENTS AND OUTCO
- Page 87 and 88: PERFORMANCE, ACHIEVEMENTS AND OUTCO
- Page 89 and 90:
PERFORMANCE, ACHIEVEMENTS AND OUTCO
- Page 91 and 92:
PERFORMANCE, ACHIEVEMENTS AND OUTCO
- Page 93 and 94:
PERFORMANCE, ACHIEVEMENTS AND OUTCO
- Page 95 and 96:
PERFORMANCE, ACHIEVEMENTS AND OUTCO
- Page 97 and 98:
PERFORMANCE, ACHIEVEMENTS AND OUTCO
- Page 99 and 100:
PERFORMANCE, ACHIEVEMENTS AND OUTCO
- Page 101 and 102:
PERFORMANCE, ACHIEVEMENTS AND OUTCO
- Page 103 and 104:
PERFORMANCE, ACHIEVEMENTS AND OUTCO
- Page 105 and 106:
PERFORMANCE, ACHIEVEMENTS AND OUTCO
- Page 107 and 108:
PERFORMANCE, ACHIEVEMENTS AND OUTCO
- Page 109 and 110:
PERFORMANCE, ACHIEVEMENTS AND OUTCO
- Page 111 and 112:
PERFORMANCE, ACHIEVEMENTS AND OUTCO
- Page 113 and 114:
PERFORMANCE, ACHIEVEMENTS AND OUTCO
- Page 115 and 116:
PERFORMANCE, ACHIEVEMENTS AND OUTCO
- Page 117 and 118:
PERFORMANCE, ACHIEVEMENTS AND OUTCO
- Page 119 and 120:
PERFORMANCE, ACHIEVEMENTS AND OUTCO
- Page 121 and 122:
PERFORMANCE, ACHIEVEMENTS AND OUTCO
- Page 123 and 124:
PERFORMANCE, ACHIEVEMENTS AND OUTCO
- Page 125 and 126:
PERFORMANCE, ACHIEVEMENTS AND OUTCO
- Page 127 and 128:
PERFORMANCE, ACHIEVEMENTS AND OUTCO
- Page 129 and 130:
PERFORMANCE, ACHIEVEMENTS AND OUTCO
- Page 131 and 132:
PERFORMANCE, ACHIEVEMENTS AND OUTCO
- Page 133 and 134:
PERFORMANCE, ACHIEVEMENTS AND OUTCO
- Page 135 and 136:
PERFORMANCE, ACHIEVEMENTS AND OUTCO
- Page 137 and 138:
PERFORMANCE, ACHIEVEMENTS AND OUTCO
- Page 139 and 140:
PERFORMANCE, ACHIEVEMENTS AND OUTCO
- Page 141 and 142:
PERFORMANCE, ACHIEVEMENTS AND OUTCO
- Page 143 and 144:
PERFORMANCE, ACHIEVEMENTS AND OUTCO
- Page 145 and 146:
PERFORMANCE, ACHIEVEMENTS AND OUTCO
- Page 147 and 148:
PERFORMANCE, ACHIEVEMENTS AND OUTCO
- Page 149 and 150:
PERFORMANCE, ACHIEVEMENTS AND OUTCO
- Page 151 and 152:
PERFORMANCE, ACHIEVEMENTS AND OUTCO
- Page 153 and 154:
PERFORMANCE, ACHIEVEMENTS AND OUTCO
- Page 155 and 156:
DEPARTMENT OF CORRECTIONAL SERVICES
- Page 157 and 158:
DEPARTMENT OF CORRECTIONAL SERVICES
- Page 159 and 160:
DEPARTMENT OF CORRECTIONAL SERVICES
- Page 161 and 162:
DEPARTMENT OF CORRECTIONAL SERVICES
- Page 163 and 164:
DEPARTMENT OF CORRECTIONAL SERVICES
- Page 165 and 166:
DEPARTMENT OF CORRECTIONAL SERVICES
- Page 167 and 168:
DEPARTMENT OF CORRECTIONAL SERVICES
- Page 169 and 170:
DEPARTMENT OF CORRECTIONAL SERVICES
- Page 171 and 172:
DEPARTMENT OF CORRECTIONAL SERVICES
- Page 173 and 174:
DEPARTMENT OF CORRECTIONAL SERVICES
- Page 175 and 176:
DEPARTMENT OF CORRECTIONAL SERVICES
- Page 177 and 178:
DEPARTMENT OF CORRECTIONAL SERVICES
- Page 179 and 180:
3. DEPARTMENT OF CORRECTIONAL SERVI
- Page 181 and 182:
DEPARTMENT OF CORRECTIONAL SERVICES
- Page 183 and 184:
DEPARTMENT OF CORRECTIONAL SERVICES
- Page 185 and 186:
DEPARTMENT OF CORRECTIONAL SERVICES
- Page 187 and 188:
DEPARTMENT OF CORRECTIONAL SERVICES
- Page 189 and 190:
DEPARTMENT OF CORRECTIONAL SERVICES
- Page 191 and 192:
DEPARTMENT OF CORRECTIONAL SERVICES
- Page 193 and 194:
23. BUDGETARY INFORMATION DEPARTMEN
- Page 195 and 196:
DEPARTMENT OF CORRECTIONAL SERVICES
- Page 197 and 198:
PERFORMANCE, ACHIEVEMENTS AND OUTCO
- Page 199 and 200:
PERFORMANCE, ACHIEVEMENTS AND OUTCO
- Page 201 and 202:
PERFORMANCE, ACHIEVEMENTS AND OUTCO
- Page 203 and 204:
PERFORMANCE, ACHIEVEMENTS AND OUTCO
- Page 205 and 206:
PERFORMANCE, ACHIEVEMENTS AND OUTCO
- Page 207 and 208:
PERFORMANCE, ACHIEVEMENTS AND OUTCO
- Page 209 and 210:
PERFORMANCE, ACHIEVEMENTS AND OUTCO
- Page 211 and 212:
PERFORMANCE, ACHIEVEMENTS AND OUTCO
- Page 213 and 214:
PERFORMANCE, ACHIEVEMENTS AND OUTCO
- Page 215 and 216:
PERFORMANCE, ACHIEVEMENTS AND OUTCO
- Page 217 and 218:
PERFORMANCE, ACHIEVEMENTS AND OUTCO
- Page 219 and 220:
PERFORMANCE, ACHIEVEMENTS AND OUTCO
- Page 221 and 222:
Contact Information The Northern Te
- Page 224:
Northern Territory Correctional Ser