

D2.1 Requirements and Specification - CORBYS
D2.1 Requirements and Specification - CORBYS
D2.1 Requirements and Specification - CORBYS

You also want an ePaper? Increase the reach of your titles
YUMPU automatically turns print PDFs into web optimized ePapers that Google loves.
<strong>D2.1</strong> <strong>Requirements</strong> <strong>and</strong> <strong>Specification</strong><br />
4.6.1.3 Injuries<br />
4.6.1.3.1 Fatal injuries<br />
The injury pyramid for EU shows on the top a total of 250000 fatal injuries. These injuries mostly comprise<br />
of children, adolescents <strong>and</strong> young adults. The Netherl<strong>and</strong>s has the lowest rate of fatal injuries in EU <strong>and</strong><br />
estimated more than 100,000 lives could be saved each year if the countries lower their injury mortality rate to<br />
the current Netherl<strong>and</strong>s rate (Injuries in the European Union Statistics Summary 2005-2007).<br />
4.6.1.3.2 Nonfatal injuries<br />
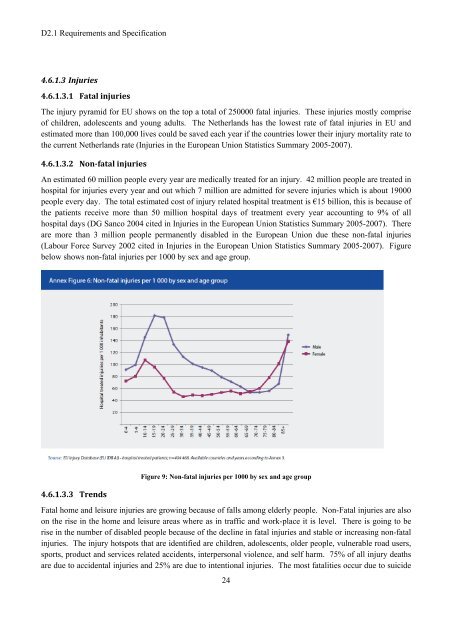
An estimated 60 million people every year are medically treated for an injury. 42 million people are treated in<br />
hospital for injuries every year <strong>and</strong> out which 7 million are admitted for severe injuries which is about 19000<br />
people every day. The total estimated cost of injury related hospital treatment is €15 billion, this is because of<br />
the patients receive more than 50 million hospital days of treatment every year accounting to 9% of all<br />
hospital days (DG Sanco 2004 cited in Injuries in the European Union Statistics Summary 2005-2007). There<br />
are more than 3 million people permanently disabled in the European Union due these non-fatal injuries<br />
(Labour Force Survey 2002 cited in Injuries in the European Union Statistics Summary 2005-2007). Figure<br />
below shows non-fatal injuries per 1000 by sex <strong>and</strong> age group.<br />
4.6.1.3.3 Trends<br />
Figure 9: Non-fatal injuries per 1000 by sex <strong>and</strong> age group<br />
Fatal home <strong>and</strong> leisure injuries are growing because of falls among elderly people. Non-Fatal injuries are also<br />
on the rise in the home <strong>and</strong> leisure areas where as in traffic <strong>and</strong> work-place it is level. There is going to be<br />
rise in the number of disabled people because of the decline in fatal injuries <strong>and</strong> stable or increasing non-fatal<br />
injuries. The injury hotspots that are identified are children, adolescents, older people, vulnerable road users,<br />
sports, product <strong>and</strong> services related accidents, interpersonal violence, <strong>and</strong> self harm. 75% of all injury deaths<br />
are due to accidental injuries <strong>and</strong> 25% are due to intentional injuries. The most fatalities occur due to suicide<br />
24