ECB Annual Report on supervisory activities
ssmar2016.en.pdf?utm_source=POLITICO.EU&utm_campaign=b1bb431652-EMAIL_CAMPAIGN_2017_03_23&utm_medium=email&utm_term=0_10959edeb5-b1bb431652-189797857&utm_source=POLITICO
ssmar2016.en.pdf?utm_source=POLITICO.EU&utm_campaign=b1bb431652-EMAIL_CAMPAIGN_2017_03_23&utm_medium=email&utm_term=0_10959edeb5-b1bb431652-189797857&utm_source=POLITICO

You also want an ePaper? Increase the reach of your titles
YUMPU automatically turns print PDFs into web optimized ePapers that Google loves.
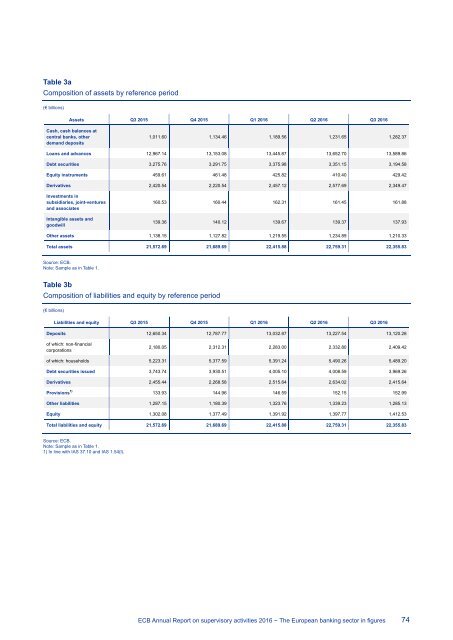
Table 3a<br />
Compositi<strong>on</strong> of assets by reference period<br />
(€ billi<strong>on</strong>s)<br />
Assets Q3 2015 Q4 2015 Q1 2016 Q2 2016 Q3 2016<br />
Cash, cash balances at<br />
central banks, other<br />
demand deposits<br />
1,011.60 1,134.46 1,189.56 1,231.65 1,282.37<br />
Loans and advances 12,967.14 13,153.08 13,445.87 13,652.70 13,589.86<br />
Debt securities 3,275.76 3,291.75 3,375.98 3,351.15 3,194.58<br />
Equity instruments 459.61 461.48 425.82 410.40 429.42<br />
Derivatives 2,420.54 2,220.54 2,457.12 2,577.69 2,349.47<br />
Investments in<br />
subsidiaries, joint-ventures<br />
and associates<br />
Intangible assets and<br />
goodwill<br />
160.53 160.44 162.31 161.45 161.88<br />
139.36 140.12 139.67 139.37 137.93<br />
Other assets 1,138.15 1,127.82 1,219.55 1,234.89 1,210.33<br />
Total assets 21,572.69 21,689.69 22,415.88 22,759.31 22,355.83<br />
Source: <str<strong>on</strong>g>ECB</str<strong>on</strong>g>.<br />
Note: Sample as in Table 1.<br />
Table 3b<br />
Compositi<strong>on</strong> of liabilities and equity by reference period<br />
(€ billi<strong>on</strong>s)<br />
Liabilities and equity Q3 2015 Q4 2015 Q1 2016 Q2 2016 Q3 2016<br />
Deposits 12,650.34 12,787.77 13,032.87 13,227.54 13,120.28<br />
of which: n<strong>on</strong>-financial<br />
corporati<strong>on</strong>s<br />
2,180.05 2,312.31 2,283.00 2,332.80 2,409.42<br />
of which: households 5,223.31 5,377.59 5,391.24 5,490.26 5,489.20<br />
Debt securities issued 3,743.74 3,930.51 4,005.10 4,008.59 3,969.26<br />
Derivatives 2,455.44 2,268.58 2,515.64 2,634.02 2,415.64<br />
Provisi<strong>on</strong>s 1) 133.93 144.96 146.59 152.15 152.99<br />
Other liabilities 1,287.15 1,180.39 1,323.76 1,339.23 1,285.13<br />
Equity 1,302.08 1,377.49 1,391.92 1,397.77 1,412.53<br />
Total liabilities and equity 21,572.69 21,689.69 22,415.88 22,759.31 22,355.83<br />
Source: <str<strong>on</strong>g>ECB</str<strong>on</strong>g>.<br />
Note: Sample as in Table 1.<br />
1) In line with IAS 37.10 and IAS 1.54(l).<br />
<str<strong>on</strong>g>ECB</str<strong>on</strong>g> <str<strong>on</strong>g>Annual</str<strong>on</strong>g> <str<strong>on</strong>g>Report</str<strong>on</strong>g> <strong>on</strong> <strong>supervisory</strong> <strong>activities</strong> 2016 − The European banking sector in figures 74