- Page 1 and 2:
The Network Society From Knowledge
- Page 3 and 4:
Castells, Manuel and Cardoso, Gusta
- Page 5 and 6: iv The Network Society Part III: Or
- Page 8 and 9: Figures Figure 2.1—Businesses usi
- Page 10 and 11: Tables Table 2.1—Technological Ac
- Page 12 and 13: Notes on Contributors Jorge Sampaio
- Page 14 and 15: Notes on Contributors xiii and Inst
- Page 16 and 17: Notes on Contributors xv Francois B
- Page 18 and 19: Acknowledgements Although dealing w
- Page 20 and 21: Editor’s Preface This volume expl
- Page 22 and 23: Editor’s Preface xxi analysis of
- Page 24 and 25: Editor’s Preface xxiii in a diffe
- Page 26: Part I: The Network Society: From K
- Page 29 and 30: 4 The Network Society Often, the em
- Page 31 and 32: 6 The Network Society social change
- Page 33 and 34: 8 The Network Society Let us start
- Page 35 and 36: 10 The Network Society instead of s
- Page 37 and 38: 12 The Network Society However, the
- Page 39 and 40: 14 The Network Society text made by
- Page 41 and 42: 16 The Network Society globalizatio
- Page 43 and 44: 18 The Network Society • At the s
- Page 45 and 46: 20 The Network Society Dilemmas of
- Page 48 and 49: Chapter 2 Societies in Transition t
- Page 50 and 51: Societies in Transition to the Netw
- Page 52 and 53: Societies in Transition to the Netw
- Page 54 and 55: These models that can be given the
- Page 58 and 59: Societies in Transition to the Netw
- Page 60 and 61: Table 2.3 Use of the Internet per c
- Page 62 and 63: are differences in the use of a tec
- Page 64 and 65: Societies in Transition to the Netw
- Page 66 and 67: Societies in Transition to the Netw
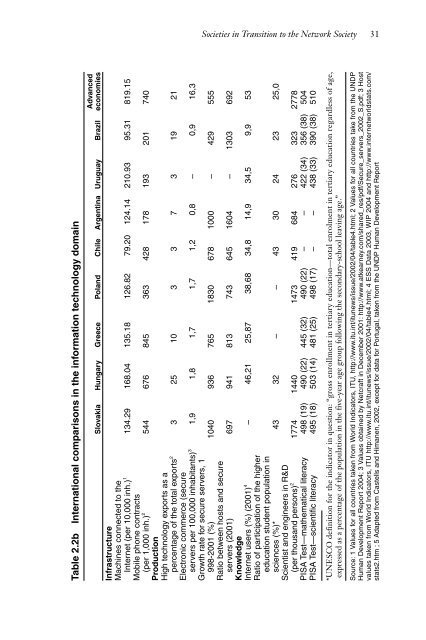
- Page 68 and 69: Table 2.9 International comparison
- Page 70 and 71: Table 2.10 Position of the informat
- Page 72 and 73: Societies in Transition to the Netw
- Page 74 and 75: Societies in Transition to the Netw
- Page 76 and 77: Table 2.12 International comparison
- Page 78 and 79: Table 2.13 International comparison
- Page 80 and 81: Societies in Transition to the Netw
- Page 82 and 83: Societies in Transition to the Netw
- Page 84 and 85: Societies in Transition to the Netw
- Page 86 and 87: Societies in Transition to the Netw
- Page 88 and 89: Table 2.18 Relationship between wat
- Page 90 and 91: Societies in Transition to the Netw
- Page 92: Societies in Transition to the Netw
- Page 96 and 97: Information Technology and the Worl
- Page 98 and 99: In Section 4 we allocate the growth
- Page 100 and 101: Information Technology and the Worl
- Page 102 and 103: Information Technology and the Worl
- Page 104 and 105: Information Technology and the Worl
- Page 106 and 107:
ut steadily for the region as a who
- Page 108 and 109:
Information Technology and the Worl
- Page 110 and 111:
input rose after 1995 from 0.72 per
- Page 112 and 113:
ution of IT investment after 1995 r
- Page 114 and 115:
Reports. We assume that IT capital
- Page 116:
Information Technology and the Worl
- Page 120 and 121:
Table 3.1 The World Economy: Shares
- Page 122 and 123:
Information Technology and the Worl
- Page 124 and 125:
Information Technology and the Worl
- Page 126 and 127:
Information Technology and the Worl
- Page 128 and 129:
Table 3.2: Levels of Output and Inp
- Page 130 and 131:
Information Technology and the Worl
- Page 132 and 133:
Information Technology and the Worl
- Page 134 and 135:
Information Technology and the Worl
- Page 136 and 137:
Table 3.3: Sources of Output Growth
- Page 138 and 139:
Information Technology and the Worl
- Page 140 and 141:
Information Technology and the Worl
- Page 142 and 143:
Information Technology and the Worl
- Page 144 and 145:
North Africa and Middle-East (11 Ec
- Page 146 and 147:
Information Technology and the Worl
- Page 148 and 149:
Information Technology and the Worl
- Page 150 and 151:
Innovation, Technology and Producti
- Page 152 and 153:
Innovation, Technology and Producti
- Page 154 and 155:
Innovation, Technology and Producti
- Page 156 and 157:
Innovation, Technology and Producti
- Page 158 and 159:
Innovation, Technology and Producti
- Page 160 and 161:
joint knowledge production—a role
- Page 162 and 163:
Innovation, Technology and Producti
- Page 164 and 165:
sonnel, realization of the Barcelon
- Page 166 and 167:
Innovation, Technology and Producti
- Page 168 and 169:
5. Activating Innovation Innovation
- Page 170 and 171:
Innovation, Technology and Producti
- Page 172:
Part III Organizational Reform and
- Page 175 and 176:
150 The Network Society interest to
- Page 177 and 178:
152 The Network Society Career civi
- Page 179 and 180:
154 The Network Society Figure 5.1
- Page 181 and 182:
156 The Network Society On the othe
- Page 183 and 184:
158 The Network Society The three g
- Page 185 and 186:
160 The Network Society networked g
- Page 187 and 188:
162 The Network Society citizens ha
- Page 189 and 190:
164 The Network Society there budge
- Page 191 and 192:
166 The Network Society online to c
- Page 193 and 194:
168 The Network Society Table 5.2 P
- Page 195 and 196:
170 The Network Society U.S. Federa
- Page 197 and 198:
172 The Network Society recently no
- Page 199 and 200:
174 The Network Society systems in
- Page 201 and 202:
176 The Network Society Appendix On
- Page 203 and 204:
178 The Network Society Consolidate
- Page 205 and 206:
180 The Network Society E-Clearance
- Page 208 and 209:
Uses of Internet and Mobile Technol
- Page 210 and 211:
Uses of Internet and Mobile Technol
- Page 212 and 213:
Portuguese on line and making it re
- Page 214 and 215:
Uses of Internet and Mobile Technol
- Page 216 and 217:
Uses of Internet and Mobile Technol
- Page 218 and 219:
Uses of Internet and Mobile Technol
- Page 220 and 221:
including those that deal with chro
- Page 222 and 223:
2002). This study demonstrates that
- Page 224 and 225:
Uses of Internet and Mobile Technol
- Page 226 and 227:
Uses of Internet and Mobile Technol
- Page 228 and 229:
Bibliography Uses of Internet and M
- Page 230 and 231:
Uses of Internet and Mobile Technol
- Page 232 and 233:
Uses of Internet and Mobile Technol
- Page 234 and 235:
Uses of Internet and Mobile Technol
- Page 236 and 237:
Uses of Internet and Mobile Technol
- Page 238 and 239:
Uses of Internet and Mobile Technol
- Page 240 and 241:
E-Learning and the Transformation o
- Page 242 and 243:
E-Learning and the Transformation o
- Page 244 and 245:
E-Learning and the Transformation o
- Page 246 and 247:
E-Learning and the Transformation o
- Page 248:
E-Learning and the Transformation o
- Page 251 and 252:
226 The Network Society In terms of
- Page 253 and 254:
228 The Network Society Outcomes Fi
- Page 255 and 256:
230 The Network Society Services Th
- Page 257 and 258:
232 The Network Society • The mov
- Page 259 and 260:
234 The Network Society Post invent
- Page 261 and 262:
236 The Network Society Future issu
- Page 263 and 264:
238 The Network Society This is the
- Page 266 and 267:
Introduction Chapter 9 The IP TV Re
- Page 268 and 269:
The IP TV Revolution 243 in every m
- Page 270 and 271:
Figure 9.2 Nevius Media Center Serv
- Page 272 and 273:
money. To understand this we must l
- Page 274 and 275:
Table 9.1 Downward Internet Streami
- Page 276 and 277:
Distributors In a new world media o
- Page 278 and 279:
Talent The IP TV Revolution 253 It
- Page 280:
The IP TV Revolution 255 in any way
- Page 283 and 284:
258 The Network Society Both the se
- Page 285 and 286:
260 The Network Society The Catalan
- Page 287 and 288:
262 The Network Society every day a
- Page 289 and 290:
264 The Network Society play in the
- Page 291 and 292:
266 The Network Society medium is h
- Page 293 and 294:
268 The Network Society Smith, A. (
- Page 295 and 296:
270 The Network Society users. Whil
- Page 297 and 298:
272 The Network Society Interesting
- Page 299 and 300:
274 The Network Society standards,
- Page 301 and 302:
276 The Network Society Our focus i
- Page 303 and 304:
278 The Network Society However the
- Page 305 and 306:
280 The Network Society offer acces
- Page 307 and 308:
282 The Network Society rural towns
- Page 309 and 310:
284 The Network Society sustain the
- Page 311 and 312:
286 The Network Society this decent
- Page 314 and 315:
Free Software and Social and Econom
- Page 316 and 317:
Free Software and Social and Econom
- Page 318 and 319:
Free Software and Social and Econom
- Page 320 and 321:
A New Form of Production Free Softw
- Page 322 and 323:
Free Software and Social and Econom
- Page 324 and 325:
the rich countries and those of the
- Page 326:
Free Software and Social and Econom
- Page 330 and 331:
Internet and Society in a Global Pe
- Page 332 and 333:
The World Internet Project is based
- Page 334 and 335:
Internet and Society in a Global Pe
- Page 336 and 337:
Internet Users Watch Less Televisio
- Page 338 and 339:
less. Would they watch the same amo
- Page 340 and 341:
tainment and the ways in which usag
- Page 342 and 343:
Internet and Society in a Global Pe
- Page 344 and 345:
Internet and Society in a Global Pe
- Page 346 and 347:
Internet and Society in a Global Pe
- Page 348:
Internet and Society in a Global Pe
- Page 351 and 352:
326 The Network Society 10. RFID (r
- Page 353 and 354:
328 The Network Society apartment a
- Page 355 and 356:
330 The Network Society The first-o
- Page 357 and 358:
332 The Network Society A practical
- Page 360:
Part VI: Policies of Transition to
- Page 363 and 364:
338 The Network Society cepts of cr
- Page 365 and 366:
340 The Network Society 4. Increase
- Page 367 and 368:
342 The Network Society Figure 15.1
- Page 369 and 370:
344 The Network Society 2. The Sing
- Page 371 and 372:
346 The Network Society 2. Communal
- Page 373 and 374:
348 The Network Society tradition,
- Page 375 and 376:
350 The Network Society The two new
- Page 377 and 378:
352 The Network Society Figure 15.4
- Page 379 and 380:
354 The Network Society not become
- Page 381 and 382:
356 The Network Society tematically
- Page 383 and 384:
358 The Network Society The basis:
- Page 385 and 386:
360 The Network Society However, th
- Page 387 and 388:
362 The Network Society Physical ba
- Page 389 and 390:
364 The Network Society Culture and
- Page 391 and 392:
366 The Network Society However, ju
- Page 393 and 394:
368 The Network Society In regard t
- Page 395 and 396:
370 The Network Society Castells, M
- Page 398 and 399:
Introduction Policies of Transition
- Page 400 and 401:
European countries embraced ICT lat
- Page 402 and 403:
Policies of Transition to the Netwo
- Page 404 and 405:
The first ‘i’ is for informatio
- Page 406 and 407:
Chapter 17 ICT as a Part of the Chi
- Page 408 and 409:
ICT as a Part of the Chilean Strate
- Page 410 and 411:
ICT as a Part of the Chilean Strate
- Page 412 and 413:
ICT as a Part of the Chilean Strate
- Page 414 and 415:
ICT as a Part of the Chilean Strate
- Page 416 and 417:
ICT as a Part of the Chilean Strate
- Page 418 and 419:
ICT as a Part of the Chilean Strate
- Page 420 and 421:
ICT as a Part of the Chilean Strate
- Page 422 and 423:
ICT as a Part of the Chilean Strate
- Page 424 and 425:
ICT as a Part of the Chilean Strate
- Page 426 and 427:
ICT as a Part of the Chilean Strate
- Page 428:
ICT as a Part of the Chilean Strate
- Page 431 and 432:
406 The Network Society tral idea i
- Page 433 and 434:
408 The Network Society Table 18.1
- Page 435 and 436:
410 The Network Society making proc
- Page 437 and 438:
412 The Network Society Lisbon stra
- Page 439 and 440:
414 The Network Society The sustain
- Page 441 and 442:
416 The Network Society European in
- Page 443 and 444:
418 The Network Society the contrib
- Page 445 and 446:
420 The Network Society individuals
- Page 447 and 448:
422 The Network Society semination
- Page 449 and 450:
424 The Network Society Council of
- Page 451 and 452:
426 The Network Society certain red
- Page 453 and 454:
428 The Network Society importance
- Page 455 and 456:
430 The Network Society parisons on
- Page 457 and 458:
432 The Network Society recommended
- Page 459 and 460:
434 The Network Society The respons


