

433369666-The-Case-for-Investing-in-South-Africa
South Africa's investment proposal
South Africa's investment proposal

You also want an ePaper? Increase the reach of your titles
YUMPU automatically turns print PDFs into web optimized ePapers that Google loves.
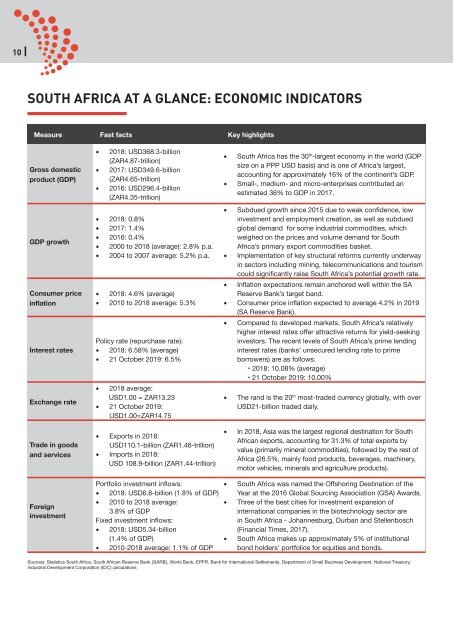
10 |<br />
SOUTH AFRICA AT A GLANCE: ECONOMIC INDICATORS<br />
Measure Fast facts Key highlights<br />
Gross domestic<br />
product (GDP)<br />
GDP growth<br />
Consumer price<br />
<strong>in</strong>flation<br />
Interest rates<br />
Exchange rate<br />
Trade <strong>in</strong> goods<br />
and services<br />
• 2018: USD368.3-billion<br />
(ZAR4.87-trillion)<br />
• 2017: USD349.6-billion<br />
(ZAR4.65-trillion)<br />
• 2016: USD296.4-billion<br />
(ZAR4.35-trillion)<br />
• 2018: 0.8%<br />
• 2017: 1.4%<br />
• 2016: 0.4%<br />
• 2000 to 2018 (average): 2.8% p.a.<br />
• 2004 to 2007 average: 5.2% p.a.<br />
• 2018: 4.6% (average)<br />
• 2010 to 2018 average: 5.3%<br />
Policy rate (repurchase rate):<br />
• 2018: 6.58% (average)<br />
• 21 October 2019: 6.5%<br />
• 2018 average:<br />
USD1.00 = ZAR13.23<br />
• 21 October 2019:<br />
USD1.00=ZAR14.75<br />
• Exports <strong>in</strong> 2018:<br />
USD110.1-billion (ZAR1.46-trillion)<br />
• Imports <strong>in</strong> 2018:<br />
USD 108.9-billion (ZAR1.44-trillion)<br />
• <strong>South</strong> <strong>Africa</strong> has the 30 th -largest economy <strong>in</strong> the world (GDP<br />
size on a PPP USD basis) and is one of <strong>Africa</strong>’s largest,<br />
account<strong>in</strong>g <strong>for</strong> approximately 16% of the cont<strong>in</strong>ent’s GDP.<br />
• Small-, medium- and micro-enterprises contributed an<br />
estimated 36% to GDP <strong>in</strong> 2017.<br />
• Subdued growth s<strong>in</strong>ce 2015 due to weak confidence, low<br />
<strong>in</strong>vestment and employment creation, as well as subdued<br />
global demand <strong>for</strong> some <strong>in</strong>dustrial commodities, which<br />
weighed on the prices and volume demand <strong>for</strong> <strong>South</strong><br />
<strong>Africa</strong>’s primary export commodities basket.<br />
• Implementation of key structural re<strong>for</strong>ms currently underway<br />
<strong>in</strong> sectors <strong>in</strong>clud<strong>in</strong>g m<strong>in</strong><strong>in</strong>g, telecommunications and tourism<br />
could significantly raise <strong>South</strong> <strong>Africa</strong>’s potential growth rate.<br />
• Inflation expectations rema<strong>in</strong> anchored well with<strong>in</strong> the SA<br />
Reserve Bank’s target band.<br />
• Consumer price <strong>in</strong>flation expected to average 4.2% <strong>in</strong> 2019<br />
(SA Reserve Bank).<br />
• Compared to developed markets, <strong>South</strong> <strong>Africa</strong>’s relatively<br />
higher <strong>in</strong>terest rates offer attractive returns <strong>for</strong> yield-seek<strong>in</strong>g<br />
<strong>in</strong>vestors. <strong>The</strong> recent levels of <strong>South</strong> <strong>Africa</strong>’s prime lend<strong>in</strong>g<br />
<strong>in</strong>terest rates (banks’ unsecured lend<strong>in</strong>g rate to prime<br />
borrowers) are as follows:<br />
• 2018: 10.08% (average)<br />
• 21 October 2019: 10.00%<br />
• <strong>The</strong> rand is the 20 th most-traded currency globally, with over<br />
USD21-billion traded daily.<br />
• In 2018, Asia was the largest regional dest<strong>in</strong>ation <strong>for</strong> <strong>South</strong><br />
<strong>Africa</strong>n exports, account<strong>in</strong>g <strong>for</strong> 31.3% of total exports by<br />
value (primarily m<strong>in</strong>eral commodities), followed by the rest of<br />
<strong>Africa</strong> (26.5%, ma<strong>in</strong>ly food products, beverages, mach<strong>in</strong>ery,<br />
motor vehicles, m<strong>in</strong>erals and agriculture products).<br />
Foreign<br />
<strong>in</strong>vestment<br />
Portfolio <strong>in</strong>vestment <strong>in</strong>flows:<br />
• 2018: USD6.8-billion (1.8% of GDP)<br />
• 2010 to 2018 average:<br />
3.8% of GDP<br />
Fixed <strong>in</strong>vestment <strong>in</strong>flows:<br />
• 2018: USD5.34-billion<br />
(1.4% of GDP)<br />
• 2010-2018 average: 1.1% of GDP<br />
• <strong>South</strong> <strong>Africa</strong> was named the Offshor<strong>in</strong>g Dest<strong>in</strong>ation of the<br />
Year at the 2016 Global Sourc<strong>in</strong>g Association (GSA) Awards.<br />
• Three of the best cities <strong>for</strong> <strong>in</strong>vestment expansion of<br />
<strong>in</strong>ternational companies <strong>in</strong> the biotechnology sector are<br />
<strong>in</strong> <strong>South</strong> <strong>Africa</strong> - Johannesburg, Durban and Stellenbosch<br />
(F<strong>in</strong>ancial Times, 2017).<br />
• <strong>South</strong> <strong>Africa</strong> makes up approximately 5% of <strong>in</strong>stitutional<br />
bond holders’ portfolios <strong>for</strong> equities and bonds.<br />
Sources: Statistics <strong>South</strong> <strong>Africa</strong>, <strong>South</strong> <strong>Africa</strong>n Reserve Bank (SARB), World Bank, EPFR, Bank <strong>for</strong> International Settlements, Department of Small Bus<strong>in</strong>ess Development, National Treasury,<br />
Industrial Development Corporation (IDC) calculations
