BAM Abbreviated Annual Report 2011 - Siteseeing in the world of ...
BAM Abbreviated Annual Report 2011 - Siteseeing in the world of ...
BAM Abbreviated Annual Report 2011 - Siteseeing in the world of ...

Create successful ePaper yourself
Turn your PDF publications into a flip-book with our unique Google optimized e-Paper software.
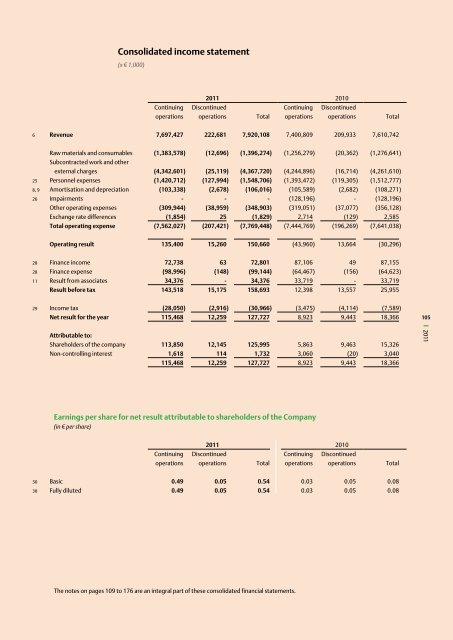
Consolidated <strong>in</strong>come statement<br />
(x € 1,000)<br />
Cont<strong>in</strong>u<strong>in</strong>g<br />
operations<br />
<strong>2011</strong> 2010<br />
Discont<strong>in</strong>ued<br />
operations<br />
Total<br />
The notes on pages 109 to 176 are an <strong>in</strong>tegral part <strong>of</strong> <strong>the</strong>se consolidated f<strong>in</strong>ancial statements.<br />
Cont<strong>in</strong>u<strong>in</strong>g<br />
operations<br />
Discont<strong>in</strong>ued<br />
operations<br />
6 Revenue 7,697,427 222,681 7,920,108 7,400,809 209,933 7,610,742<br />
Raw materials and consumables (1,383,578) (12,696) (1,396,274) (1,256,279) (20,362) (1,276,641)<br />
Subcontracted work and o<strong>the</strong>r<br />
external charges (4,342,601) (25,119) (4,367,720) (4,244,896) (16,714) (4,261,610)<br />
25 Personnel expenses (1,420,712) (127,994) (1,548,706) (1,393,472) (119,305) (1,512,777)<br />
8, 9 Amortisation and depreciation (103,338) (2,678) (106,016) (105,589) (2,682) (108,271)<br />
26 Impairments - - - (128,196) - (128,196)<br />
O<strong>the</strong>r operat<strong>in</strong>g expenses (309,944) (38,959) (348,903) (319,051) (37,077) (356,128)<br />
Exchange rate differences (1,854) 25 (1,829) 2,714 (129) 2,585<br />
Total operat<strong>in</strong>g expense (7,562,027) (207,421) (7,769,448) (7,444,769) (196,269) (7,641,038)<br />
Operat<strong>in</strong>g result 135,400 15,260 150,660 (43,960) 13,664 (30,296)<br />
28 F<strong>in</strong>ance <strong>in</strong>come 72,738 63 72,801 87,106 49 87,155<br />
28 F<strong>in</strong>ance expense (98,996) (148) (99,144) (64,467) (156) (64,623)<br />
11 Result from associates 34,376 - 34,376 33,719 - 33,719<br />
Result before tax 143,518 15,175 158,693 12,398 13,557 25,955<br />
29 Income tax (28,050) (2,916) (30,966) (3,475) (4,114) (7,589)<br />
Net result for <strong>the</strong> year 115,468 12,259 127,727 8,923 9,443 18,366<br />
Attributable to:<br />
Shareholders <strong>of</strong> <strong>the</strong> company 113,850 12,145 125,995 5,863 9,463 15,326<br />
Non-controll<strong>in</strong>g <strong>in</strong>terest 1,618 114 1,732 3,060 (20) 3,040<br />
115,468 12,259 127,727 8,923 9,443 18,366<br />
Earn<strong>in</strong>gs per share for net result attributable to shareholders <strong>of</strong> <strong>the</strong> Company<br />
(<strong>in</strong> € per share)<br />
Cont<strong>in</strong>u<strong>in</strong>g<br />
operations<br />
<strong>2011</strong> 2010<br />
Discont<strong>in</strong>ued<br />
Cont<strong>in</strong>u<strong>in</strong>g Discont<strong>in</strong>ued<br />
operations<br />
Total operations operations<br />
30 Basic 0.49 0.05 0.54 0.03 0.05 0.08<br />
30 Fully diluted 0.49 0.05 0.54 0.03 0.05 0.08<br />
Total<br />
Total<br />
105<br />
<strong>2011</strong>