BAM Abbreviated Annual Report 2011 - Siteseeing in the world of ...
BAM Abbreviated Annual Report 2011 - Siteseeing in the world of ...
BAM Abbreviated Annual Report 2011 - Siteseeing in the world of ...

You also want an ePaper? Increase the reach of your titles
YUMPU automatically turns print PDFs into web optimized ePapers that Google loves.
116<br />
<strong>2011</strong><br />
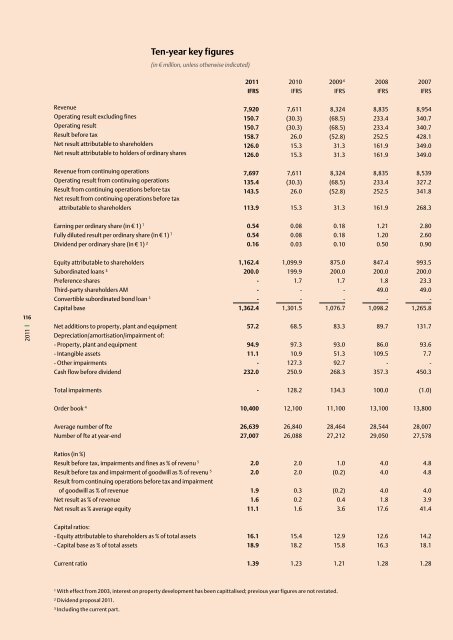
Ten-year key figures<br />
(<strong>in</strong> € million, unless o<strong>the</strong>rwise <strong>in</strong>dicated)<br />
<strong>2011</strong> 2010 2009 6 2008 2007<br />
IFRS IFRS IFRS IFRS IFRS<br />
Revenue 7,920 7,611 8,324 8,835 8,954<br />
Operat<strong>in</strong>g result exclud<strong>in</strong>g f<strong>in</strong>es 150.7 (30.3) (68.5) 233.4 340.7<br />
Operat<strong>in</strong>g result 150.7 (30.3) (68.5) 233.4 340.7<br />
Result before tax 158.7 26.0 (52.8) 252.5 428.1<br />
Net result attributable to shareholders 126.0 15.3 31.3 161.9 349.0<br />
Net result attributable to holders <strong>of</strong> ord<strong>in</strong>ary shares 126.0 15.3 31.3 161.9 349.0<br />
Revenue from cont<strong>in</strong>u<strong>in</strong>g operations 7,697 7,611 8,324 8,835 8,539<br />
Operat<strong>in</strong>g result from cont<strong>in</strong>u<strong>in</strong>g operations 135.4 (30.3) (68.5) 233.4 327.2<br />
Result from cont<strong>in</strong>u<strong>in</strong>g operations before tax<br />
Net result from cont<strong>in</strong>u<strong>in</strong>g operations before tax<br />
143.5 26.0 (52.8) 252.5 341.8<br />
attributable to shareholders 113.9 15.3 31.3 161.9 268.3<br />
Earn<strong>in</strong>g per ord<strong>in</strong>ary share (<strong>in</strong> € 1) 7 0.54 0.08 0.18 1.21 2.80<br />
Fully diluted result per ord<strong>in</strong>ary share (<strong>in</strong> € 1) 7 0.54 0.08 0.18 1.20 2.60<br />
Dividend per ord<strong>in</strong>ary share (<strong>in</strong> € 1) ² 0.16 0.03 0.10 0.50 0.90<br />
Equity attributable to shareholders 1,162.4 1,099.9 875.0 847.4 993.5<br />
Subord<strong>in</strong>ated loans ³ 200.0 199.9 200.0 200.0 200.0<br />
Preference shares - 1.7 1.7 1.8 23.3<br />
Third-party shareholders AM - - - 49.0 49.0<br />
Convertible subord<strong>in</strong>ated bond loan 3 - - - - -<br />
Capital base 1,362.4 1,301.5 1,076.7 1,098.2 1,265.8<br />
Net additions to property, plant and equipment<br />
Depreciation/amortisation/impairment <strong>of</strong>:<br />
57.2 68.5 83.3 89.7 131.7<br />
- Property, plant and equipment 94.9 97.3 93.0 86.0 93.6<br />
- Intangible assets 11.1 10.9 51.3 109.5 7.7<br />
- O<strong>the</strong>r impairments - 127.3 92.7 - -<br />
Cash flow before dividend 232.0 250.9 268.3 357.3 450.3<br />
Total impairments - 128.2 134.3 100.0 (1.0)<br />
Order book 4 10,400 12,100 11,100 13,100 13,800<br />
Average number <strong>of</strong> fte 26,639 26,840 28,464 28,544 28,007<br />
Number <strong>of</strong> fte at year-end 27,007 26,088 27,212 29,050 27,578<br />
Ratios (<strong>in</strong> %)<br />
Result before tax, impairments and f<strong>in</strong>es as % <strong>of</strong> revenu 5 2.0 2.0 1.0 4.0 4.8<br />
Result before tax and impairment <strong>of</strong> goodwill as % <strong>of</strong> revenu 5 Result from cont<strong>in</strong>u<strong>in</strong>g operations before tax and impairment<br />
2.0 2.0 (0.2) 4.0 4.8<br />
<strong>of</strong> goodwill as % <strong>of</strong> revenue 1.9 0.3 (0.2) 4.0 4.0<br />
Net result as % <strong>of</strong> revenue 1.6 0.2 0.4 1.8 3.9<br />
Net result as % average equity 11.1 1.6 3.6 17.6 41.4<br />
Capital ratios:<br />
- Equity attributable to shareholders as % <strong>of</strong> total assets 16.1 15.4 12.9 12.6 14.2<br />
- Capital base as % <strong>of</strong> total assets 18.9 18.2 15.8 16.3 18.1<br />
Current ratio 1.39 1.23 1.21 1.28 1.28<br />
¹ With effect from 2003, <strong>in</strong>terest on property development has been capittalised; previous year figures are not restated.<br />
² Dividend proposal <strong>2011</strong>.<br />
³ Includ<strong>in</strong>g <strong>the</strong> current part.