

Development and Globalization: - Unctad
Development and Globalization: - Unctad
Development and Globalization: - Unctad

Create successful ePaper yourself
Turn your PDF publications into a flip-book with our unique Google optimized e-Paper software.
100<br />
90<br />
80<br />
70<br />
60<br />
50<br />
40<br />
30<br />
20<br />
10<br />
0<br />
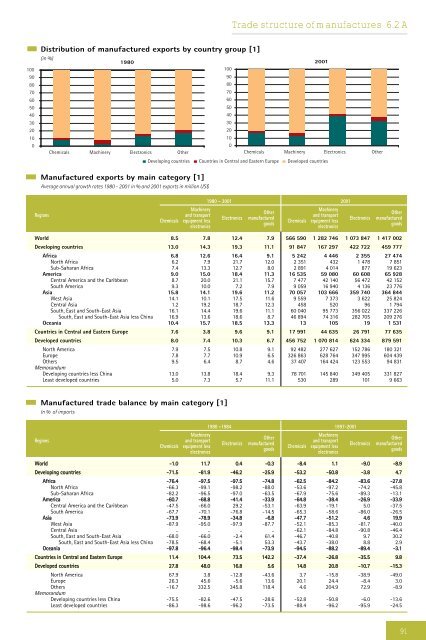
Distribution of manufactured exports by country group [1]<br />
(in %)<br />
1980<br />
100<br />
Chemicals Machinery Electronics Other<br />
Manufactured exports by main category [1]<br />
Average annual growth rates 1980 - 2001 in % <strong>and</strong> 2001 exports in million US$<br />
90<br />
80<br />
70<br />
60<br />
50<br />
40<br />
30<br />
20<br />
10<br />
0<br />
Trade structure of manufactures 6.2 A<br />
2001<br />
Chemicals Machinery Electronics Other<br />
Developing countries Countries in Central <strong>and</strong> Eastern Europe Developed countries<br />
1980 – 2001 2001<br />
Regions<br />
Chemicals<br />
Machinery<br />
<strong>and</strong> transport<br />
equipment less<br />
electronics<br />
Electronics<br />
Other<br />
manufactured<br />
goods<br />
Chemicals<br />
Machinery<br />
<strong>and</strong> transport<br />
equipment less<br />
electronics<br />
Electronics<br />
Other<br />
manufactured<br />
goods<br />
World 8.5 7.8 12.4 7.9 566 590 1 282 746 1 073 847 1 417 002<br />
Developing countries 13.0 14.3 19.3 11.1 91 847 167 297 422 722 459 777<br />
Africa 6.8 12.6 16.4 9.1 5 242 4 446 2 355 27 474<br />
North Africa 6.2 7.9 21.7 12.0 2 351 432 1 478 7 851<br />
Sub-Saharan Africa 7.4 13.3 12.7 8.0 2 891 4 014 877 19 623<br />
America 9.0 15.0 18.4 11.3 16 535 59 080 60 608 65 928<br />
Central America <strong>and</strong> the Caribbean 8.7 20.0 21.1 15.7 7 477 42 140 56 472 42 152<br />
South America 9.3 10.0 7.2 7.9 9 059 16 940 4 136 23 776<br />
Asia 15.8 14.1 19.6 11.2 70 057 103 666 359 740 364 844<br />
West Asia 14.1 10.1 17.5 11.6 9 559 7 373 3 622 25 824<br />
Central Asia 1.2 19.2 18.7 12.3 458 520 96 1 794<br />
South, East <strong>and</strong> South-East Asia 16.1 14.4 19.6 11.1 60 040 95 773 356 022 337 226<br />
South, East <strong>and</strong> South-East Asia less China 16.9 13.6 18.6 8.7 46 894 74 316 282 705 209 276<br />
Oceania 10.4 15.7 18.5 13.3 13 105 19 1 531<br />
Countries in Central <strong>and</strong> Eastern Europe 7.6 3.8 9.6 9.1 17 991 44 635 26 791 77 635<br />
Developed countries 8.0 7.4 10.3 6.7 456 752 1 070 814 624 334 879 591<br />
North America 7.9 7.5 10.8 9.1 92 482 277 627 152 786 180 321<br />
Europe 7.8 7.7 10.9 6.5 326 863 628 764 347 995 604 439<br />
Others<br />
Memor<strong>and</strong>um<br />
9.5 6.4 8.7 4.6 37 407 164 424 123 553 94 831<br />
Developing countries less China 13.0 13.8 18.4 9.3 78 701 145 840 349 405 331 827<br />
Least developed countries 5.0 7.3 5.7 11.1 530 289 101 9 663<br />
Manufactured trade balance by main category [1]<br />
In % of imports<br />
1980 –1984 1997-2001<br />
Regions<br />
Chemicals<br />
Machinery<br />
<strong>and</strong> transport<br />
equipment less<br />
electronics<br />
Electronics<br />
Other<br />
manufactured<br />
goods<br />
Chemicals<br />
Machinery<br />
<strong>and</strong> transport<br />
equipment less<br />
electronics<br />
Electronics<br />
Other<br />
manufactured<br />
goods<br />
World -1.0 11.7 0.4 -0.3 -8.4 1.1 -9.0 -8.9<br />
Developing countries -71.5 -81.9 -46.2 -25.9 -53.2 -50.8 -3.8 4.7<br />
Africa -76.4 -97.5 -97.5 -74.8 -62.5 -84.2 -83.6 -27.8<br />
North Africa -66.3 -99.1 -98.2 -88.0 -53.6 -97.2 -74.2 -45.8<br />
Sub-Saharan Africa -82.2 -96.5 -97.0 -63.5 -67.9 -75.6 -89.3 -13.1<br />
America -60.7 -68.8 -41.4 -33.9 -64.8 -38.4 -26.9 -33.9<br />
Central America <strong>and</strong> the Caribbean -47.5 -66.0 29.2 -53.1 -63.9 -19.1 5.0 -37.5<br />
South America -67.7 -70.1 -76.8 -14.5 -65.3 -58.6 -86.0 -26.5<br />
Asia -73.9 -78.9 -34.8 -6.8 -47.7 -51.2 4.6 19.9<br />
West Asia -87.9 -95.0 -97.9 -87.7 -52.1 -85.3 -81.7 -40.0<br />
Central Asia .. .. .. .. -62.1 -84.8 -90.8 -46.4<br />
South, East <strong>and</strong> South-East Asia -68.0 -66.0 -2.4 61.4 -46.7 -40.8 9.7 30.2<br />
South, East <strong>and</strong> South-East Asia less China -78.5 -68.4 -5.1 53.3 -43.7 -38.0 8.8 2.9<br />
Oceania -97.8 -96.4 -98.4 -73.9 -94.5 -88.2 -89.4 -3.1<br />
Countries in Central <strong>and</strong> Eastern Europe 11.4 104.4 73.5 142.2 -37.4 -26.8 -35.5 9.8<br />
Developed countries 27.8 48.0 16.8 5.6 14.8 20.8 -10.7 -15.3<br />
North America 67.9 3.8 -12.8 -43.6 3.7 -15.8 -38.9 -49.0<br />
Europe 26.3 45.6 -5.6 13.6 20.1 24.4 -8.4 3.0<br />
Others<br />
Memor<strong>and</strong>um<br />
-16.7 332.5 345.8 118.4 4.6 204.9 72.9 -8.9<br />
Developing countries less China -75.5 -82.6 -47.5 -28.6 -52.8 -50.8 -6.0 -13.6<br />
Least developed countries -86.3 -98.6 -96.2 -73.5 -88.4 -96.2 -95.9 -24.5<br />
91


