

Development and Globalization: - Unctad
Development and Globalization: - Unctad
Development and Globalization: - Unctad

You also want an ePaper? Increase the reach of your titles
YUMPU automatically turns print PDFs into web optimized ePapers that Google loves.
35<br />
30<br />
25<br />
20<br />
15<br />
10<br />
5<br />
0<br />
Region 1980-1983 1984-1987 1988-1990 1991-1993 1994-1996 1997-1999 2000-2001<br />
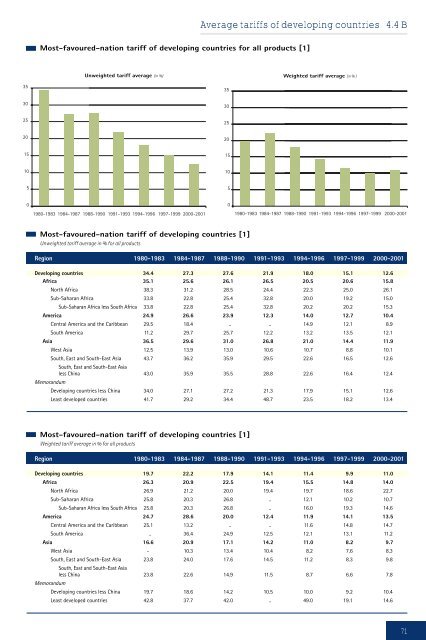
Developing countries 34.4 27.3 27.6 21.9 18.0 15.1 12.6<br />
Africa 35.1 25.6 26.1 26.5 20.5 20.6 15.8<br />
North Africa 38.3 31.2 28.5 24.4 22.3 25.0 26.1<br />
Sub-Saharan Africa 33.8 22.8 25.4 32.8 20.0 19.2 15.0<br />
Sub-Saharan Africa less South Africa 33.8 22.8 25.4 32.8 20.2 20.2 15.3<br />
America 24.9 26.6 23.9 12.3 14.0 12.7 10.4<br />
Central America <strong>and</strong> the Caribbean 29.5 18.4 .. .. 14.9 12.1 8.9<br />
South America 11.2 29.7 25.7 12.2 13.2 13.5 12.1<br />
Asia 36.5 29.6 31.0 26.8 21.0 14.4 11.9<br />
West Asia 12.5 13.9 13.0 10.6 10.7 8.8 10.1<br />
South, East <strong>and</strong> South-East Asia<br />
South, East <strong>and</strong> South-East Asia<br />
43.7 36.2 35.9 29.5 22.6 16.5 12.6<br />
less China 43.0 35.9 35.5 28.8 22.6 16.4 12.4<br />
Memor<strong>and</strong>um<br />
Unweighted tariff average (in %)<br />
Average tariffs of developing countries 4.4 B<br />
Most-favoured-nation tariff of developing countries for all products [1]<br />
1980-1983 1984-1987 1988-1990 1991-1993 1994-1996 1997-1999 2000-2001 1980-1983 1984-1987 1988-1990 1991-1993 1994-1996 1997-1999 2000-2001<br />
Most-favoured-nation tariff of developing countries [1]<br />
Unweighted tariff average in % for all products<br />
Developing countries less China 34.0 27.1 27.2 21.3 17.9 15.1 12.6<br />
Least developed countries 41.7 29.2 34.4 48.7 23.5 18.2 13.4<br />
Most-favoured-nation tariff of developing countries [1]<br />
Weighted tariff average in % for all products<br />
Region 1980-1983 1984-1987 1988-1990 1991-1993 1994-1996 1997-1999 2000-2001<br />
Developing countries 19.7 22.2 17.9 14.1 11.4 9.9 11.0<br />
Africa 26.3 20.9 22.5 19.4 15.5 14.8 14.0<br />
North Africa 26.9 21.2 20.0 19.4 19.7 18.6 22.7<br />
Sub-Saharan Africa 25.8 20.3 26.8 .. 12.1 10.2 10.7<br />
Sub-Saharan Africa less South Africa 25.8 20.3 26.8 .. 16.0 19.3 14.6<br />
America 24.7 28.6 20.0 12.4 11.9 14.1 13.5<br />
Central America <strong>and</strong> the Caribbean 25.1 13.2 .. .. 11.6 14.8 14.7<br />
South America .. 36.4 24.9 12.5 12.1 13.1 11.2<br />
Asia 16.6 20.9 17.1 14.2 11.0 8.2 9.7<br />
West Asia - 10.3 13.4 10.4 8.2 7.6 8.3<br />
South, East <strong>and</strong> South-East Asia<br />
South, East <strong>and</strong> South-East Asia<br />
23.8 24.0 17.6 14.5 11.2 8.3 9.8<br />
less China 23.8 22.6 14.9 11.5 8.7 6.6 7.8<br />
Memor<strong>and</strong>um<br />
Developing countries less China 19.7 18.6 14.2 10.5 10.0 9.2 10.4<br />
Least developed countries 42.8 37.7 42.0 .. 49.0 19.1 14.6<br />
35<br />
30<br />
25<br />
20<br />
15<br />
10<br />
5<br />
0<br />
Weighted tariff average (in % )<br />
71


