

Development and Globalization: - Unctad
Development and Globalization: - Unctad
Development and Globalization: - Unctad

You also want an ePaper? Increase the reach of your titles
YUMPU automatically turns print PDFs into web optimized ePapers that Google loves.
60<br />
50<br />
40<br />
30<br />
20<br />
10<br />
0<br />
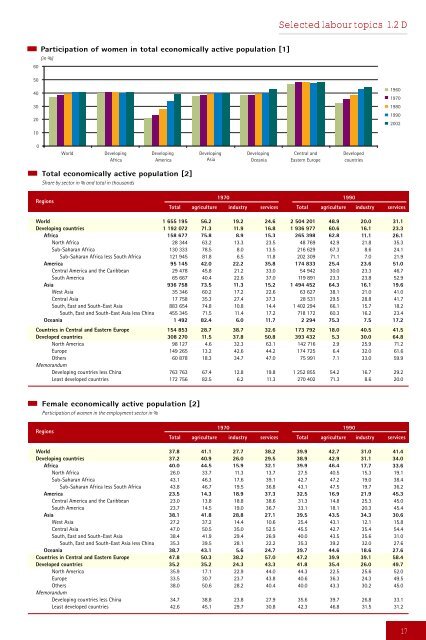
Participation of women in total economically active population [1]<br />
(in %)<br />
World Developing<br />
Africa<br />
Developing<br />
America<br />
Total economically active population [2]<br />
Share by sector in % <strong>and</strong> total in thous<strong>and</strong>s<br />
Regions<br />
Developing<br />
Asia<br />
Developing<br />
Oceania<br />
Selected labour topics 1.2 D<br />
Central <strong>and</strong><br />
Eastern Europe<br />
Developed<br />
countries<br />
1960<br />
1970<br />
1980<br />
1990<br />
2002<br />
1970 1990<br />
Total agriculture industry services Total agriculture industry services<br />
World 1 655 195 56.2 19.2 24.6 2 504 201 48.9 20.0 31.1<br />
Developing countries 1 192 072 71.3 11.9 16.8 1 936 977 60.6 16.1 23.3<br />
Africa 158 677 75.8 8.9 15.3 265 398 62.8 11.1 26.1<br />
North Africa 28 344 63.2 13.3 23.5 48 769 42.9 21.8 35.3<br />
Sub-Saharan Africa 130 333 78.5 8.0 13.5 216 629 67.3 8.6 24.1<br />
Sub-Saharan Africa less South Africa 121 945 81.8 6.5 11.8 202 309 71.1 7.0 21.9<br />
America 95 145 42.0 22.2 35.8 174 833 25.4 23.6 51.0<br />
Central America <strong>and</strong> the Caribbean 29 478 45.8 21.2 33.0 54 942 30.0 23.3 46.7<br />
South America 65 667 40.4 22.6 37.0 119 891 23.3 23.8 52.9<br />
Asia 936 758 73.5 11.3 15.2 1 494 452 64.3 16.1 19.6<br />
West Asia 35 346 60.2 17.2 22.6 63 627 38.1 21.0 41.0<br />
Central Asia 17 758 35.3 27.4 37.3 28 531 29.5 28.8 41.7<br />
South, East <strong>and</strong> South-East Asia 883 654 74.8 10.8 14.4 1 402 294 66.1 15.7 18.2<br />
South, East <strong>and</strong> South-East Asia less China 455 345 71.5 11.4 17.2 718 172 60.3 16.2 23.4<br />
Oceania 1 492 82.4 6.0 11.7 2 294 75.3 7.5 17.2<br />
Countries in Central <strong>and</strong> Eastern Europe 154 853 28.7 38.7 32.6 173 792 18.0 40.5 41.5<br />
Developed countries 308 270 11.5 37.8 50.8 393 432 5.3 30.0 64.8<br />
North America 98 127 4.6 32.3 63.1 142 716 2.9 25.9 71.2<br />
Europe 149 265 13.2 42.6 44.2 174 725 6.4 32.0 61.6<br />
Others<br />
Memor<strong>and</strong>um<br />
60 878 18.3 34.7 47.0 75 991 7.1 33.0 59.9<br />
Developing countries less China 763 763 67.4 12.8 19.8 1 252 855 54.2 16.7 29.2<br />
Least developed countries 172 756 82.5 6.2 11.3 270 402 71.3 8.6 20.0<br />
Female economically active population [2]<br />
Participation of women in the employment sector in %<br />
Regions<br />
1970 1990<br />
Total agriculture industry services Total agriculture industry services<br />
World 37.8 41.1 27.7 38.2 39.9 42.7 31.0 41.4<br />
Developing countries 37.2 40.9 26.0 29.5 38.9 42.9 31.1 34.0<br />
Africa 40.0 44.5 15.9 32.1 39.9 46.4 17.7 33.6<br />
North Africa 26.0 33.7 11.3 13.7 27.5 40.5 15.3 19.1<br />
Sub-Saharan Africa 43.1 46.3 17.6 39.1 42.7 47.2 19.0 38.4<br />
Sub-Saharan Africa less South Africa 43.8 46.7 19.5 36.8 43.1 47.5 19.7 36.2<br />
America 23.5 14.3 18.9 37.3 32.5 16.9 21.9 45.3<br />
Central America <strong>and</strong> the Caribbean 23.0 13.8 18.8 38.6 31.3 14.8 25.3 45.0<br />
South America 23.7 14.5 19.0 36.7 33.1 18.1 20.3 45.4<br />
Asia 38.1 41.8 28.8 27.1 39.5 43.5 34.3 30.6<br />
West Asia 27.2 37.2 14.4 10.6 25.4 43.1 12.1 15.8<br />
Central Asia 47.0 50.5 35.0 52.5 45.5 42.7 35.4 54.4<br />
South, East <strong>and</strong> South-East Asia 38.4 41.9 29.4 26.9 40.0 43.5 35.6 31.0<br />
South, East <strong>and</strong> South-East Asia less China 35.3 39.5 28.1 22.2 35.3 39.2 32.0 27.6<br />
Oceania 38.7 43.1 5.6 24.7 39.7 44.6 18.6 27.6<br />
Countries in Central <strong>and</strong> Eastern Europe 47.8 50.3 38.2 57.0 47.2 39.9 39.1 58.4<br />
Developed countries 35.2 35.2 24.3 43.3 41.8 35.4 26.0 49.7<br />
North America 35.9 17.1 22.9 44.0 44.3 22.5 25.6 52.0<br />
Europe 33.5 30.7 23.7 43.8 40.6 36.3 24.3 49.5<br />
Others 38.0 50.6 28.2 40.4 40.0 43.3 30.2 45.0<br />
Memor<strong>and</strong>um<br />
Developing countries less China 34.7 38.8 23.8 27.9 35.6 39.7 26.8 33.1<br />
Least developed countries 42.6 45.1 29.7 30.8 42.3 46.8 31.5 31.2<br />
17


