

Development and Globalization: - Unctad
Development and Globalization: - Unctad
Development and Globalization: - Unctad

You also want an ePaper? Increase the reach of your titles
YUMPU automatically turns print PDFs into web optimized ePapers that Google loves.
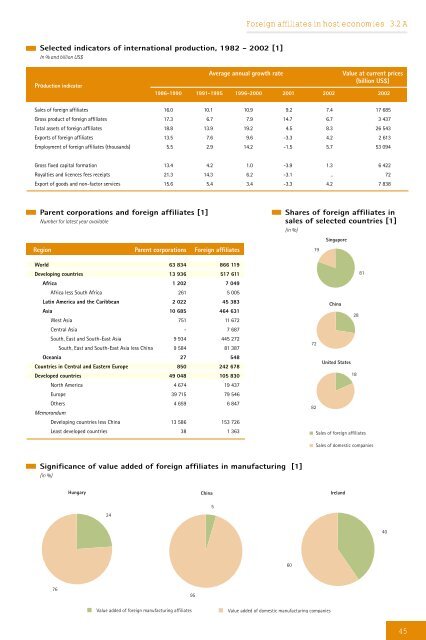
Selected indicators of international production, 1982 - 2002 [1]<br />
In % <strong>and</strong> billion US$<br />
Production indicator<br />
Parent corporations <strong>and</strong> foreign affiliates [1]<br />
Number for latest year available<br />
Region Parent corporations Foreign affiliates<br />
World 63 834 866 119<br />
Developing countries 13 936 517 611<br />
Africa 1 202 7 049<br />
Africa less South Africa 261 5 005<br />
Latin America <strong>and</strong> the Caribbean 2 022 45 383<br />
Asia 10 685 464 631<br />
West Asia 751 11 672<br />
Central Asia - 7 687<br />
South, East <strong>and</strong> South-East Asia 9 934 445 272<br />
South, East <strong>and</strong> South-East Asia less China 9 584 81 387<br />
Oceania 27 548<br />
Countries in Central <strong>and</strong> Eastern Europe 850 242 678<br />
Developed countries 49 048 105 830<br />
North America 4 674 19 437<br />
Europe 39 715 79 546<br />
Others<br />
Memor<strong>and</strong>um<br />
4 659 6 847<br />
Developing countries less China 13 586 153 726<br />
Least developed countries 38 1 363<br />
76<br />
Hungary<br />
24<br />
95<br />
China<br />
5<br />
Foreign affiliates in host economies 3.2 A<br />
Average annual growth rate Value at current prices<br />
(billion US$)<br />
1986-1990 1991-1995 1996-2000 2001 2002 2002<br />
Sales of foreign affiliates 16.0 10.1 10.9 9.2 7.4 17 685<br />
Gross product of foreign affiliates 17.3 6.7 7.9 14.7 6.7 3 437<br />
Total assets of foreign affiliates 18.8 13.9 19.2 4.5 8.3 26 543<br />
Exports of foreign affiliates 13.5 7.6 9.6 -3.3 4.2 2 613<br />
Employment of foreign affiliates (thous<strong>and</strong>s) 5.5 2.9 14.2 -1.5 5.7 53 094<br />
Gross fixed capital formation 13.4 4.2 1.0 -3.9 1.3 6 422<br />
Royalties <strong>and</strong> licences fees receipts 21.3 14.3 6.2 -3.1 .. 72<br />
Export of goods <strong>and</strong> non-factor services 15.6 5.4 3.4 -3.3 4.2 7 838<br />
Significance of value added of foreign affiliates in manufacturing [1]<br />
(in %)<br />
Value added of foreign manufacturing affiliates Value added of domestic manufacturing companies<br />
Shares of foreign affiliates in<br />
sales of selected countries [1]<br />
(in %)<br />
60<br />
19<br />
72<br />
82<br />
Singapore<br />
China<br />
United States<br />
Irel<strong>and</strong><br />
28<br />
18<br />
81<br />
Sales of foreign affiliates<br />
Sales of domestic companies<br />
40<br />
45


