

Development and Globalization: - Unctad
Development and Globalization: - Unctad
Development and Globalization: - Unctad

Create successful ePaper yourself
Turn your PDF publications into a flip-book with our unique Google optimized e-Paper software.
2001<br />
1990<br />
1980<br />
1970<br />
12<br />
8<br />
4<br />
0<br />
600<br />
500<br />
400<br />
300<br />
200<br />
100<br />
0<br />
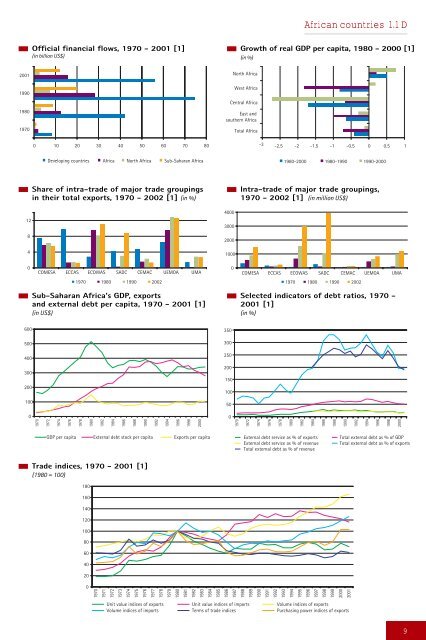
Official financial flows, 1970 - 2001 [1]<br />
(in billion US$)<br />
0 10 20 30 40 50 60 70 80<br />
Developing countries Africa North Africa Sub-Saharan Africa<br />
Share of intra-trade of major trade groupings<br />
in their total exports, 1970 - 2002 [1] (in %)<br />
COMESA ECCAS ECOWAS SADC CEMAC UEMOA UMA<br />
1970 1980 1990 2002<br />
Sub-Saharan Africa's GDP, exports<br />
<strong>and</strong> external debt per capita, 1970 - 2001 [1]<br />
(in US$)<br />
1970<br />
1972<br />
1974<br />
1976<br />
1978<br />
GDP per capita External debt stock per capita Exports per capita<br />
180<br />
160<br />
140<br />
120<br />
100<br />
80<br />
60<br />
40<br />
20<br />
0<br />
1980<br />
1982<br />
1984<br />
1986<br />
1988<br />
1990<br />
Trade indices, 1970 - 2001 [1]<br />
(1980 = 100)<br />
1992<br />
1994<br />
1996<br />
1998<br />
2000<br />
North Africa<br />
West Africa<br />
Central Africa<br />
East <strong>and</strong><br />
southern Africa<br />
4000<br />
3000<br />
2000<br />
1000<br />
350<br />
300<br />
250<br />
200<br />
50<br />
0<br />
0<br />
150<br />
100<br />
Total Africa<br />
-3 -2.5 -2 -1.5 -1 -0.5 0 0.5 1<br />
1980-2000 1980-1990 1990-2000<br />
COMESA ECCAS ECOWAS SADC CEMAC UEMOA UMA<br />
External debt service as % of exports<br />
External debt service as % of revenue<br />
Total external debt as % of revenue<br />
1970 1980 1990 2002<br />
1970<br />
1971<br />
1972<br />
1973<br />
1974<br />
1975<br />
1976<br />
1977<br />
1978<br />
1979<br />
1980<br />
1981<br />
1982<br />
1983<br />
1984<br />
1985<br />
1986<br />
1987<br />
1988<br />
1989<br />
1990<br />
1991<br />
1992<br />
1993<br />
1994<br />
1995<br />
1996<br />
1997<br />
1998<br />
1999<br />
2000<br />
2001<br />
Unit value indices of exports Unit value indices of imports Volume indices of exports<br />
Volume indices of imports Terms of trade indices Purchasing power indices of exports<br />
1970<br />
1972<br />
1974<br />
1976<br />
1978<br />
1980<br />
1982<br />
African countries 1.1 D<br />
Growth of real GDP per capita, 1980 - 2000 [1]<br />
(in %)<br />
Intra-trade of major trade groupings,<br />
1970 - 2002 [1] (in million US$)<br />
Selected indicators of debt ratios, 1970 -<br />
2001 [1]<br />
(in %)<br />
1984<br />
1986<br />
1988<br />
1990<br />
1992<br />
1994<br />
1996<br />
1998<br />
2000<br />
Total external debt as % of GDP<br />
Total external debt as % of exports<br />
9


