

Development and Globalization: - Unctad
Development and Globalization: - Unctad
Development and Globalization: - Unctad

Create successful ePaper yourself
Turn your PDF publications into a flip-book with our unique Google optimized e-Paper software.
1966<br />
2000<br />
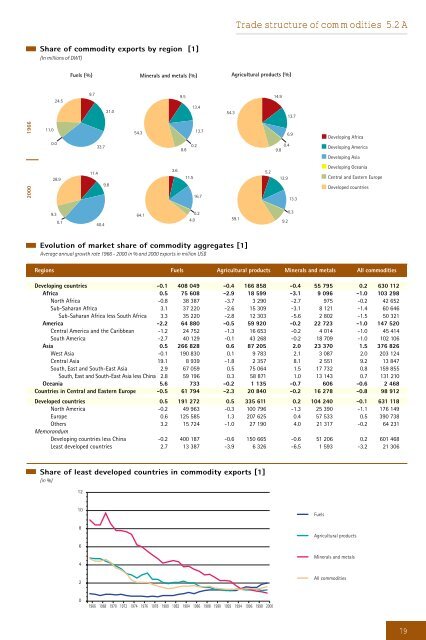
Share of commodity exports by region [1]<br />
(In millions of DWT)<br />
11.0<br />
0.0<br />
24.5<br />
28.9<br />
9.3<br />
0.1<br />
Fuels (%)<br />
Trade structure of commodities 5.2 A<br />
Regions Fuels Agricultural products Minerals <strong>and</strong> metals All commodities<br />
Developing countries -0.1 408 049 -0.4 166 858 -0.4 55 795 0.2 630 112<br />
Africa 0.5 75 608 -2.9 18 599 -3.1 9 096 -1.0 103 298<br />
North Africa -0.8 38 387 -3.7 3 290 -2.7 975 -0.2 42 652<br />
Sub-Saharan Africa 3.1 37 220 -2.6 15 309 -3.1 8 121 -1.4 60 646<br />
Sub-Saharan Africa less South Africa 3.3 35 220 -2.8 12 303 -5.6 2 802 -1.5 50 321<br />
America -2.2 64 880 -0.5 59 920 -0.2 22 723 -1.0 147 520<br />
Central America <strong>and</strong> the Caribbean -1.2 24 752 -1.3 16 653 -0.2 4 014 -1.0 45 414<br />
South America -2.7 40 129 -0.1 43 268 -0.2 18 709 -1.0 102 106<br />
Asia 0.5 266 828 0.6 87 205 2.0 23 370 1.5 376 826<br />
West Asia -0.1 190 830 0.1 9 783 2.1 3 087 2.0 203 124<br />
Central Asia 19.1 8 939 -1.8 2 357 8.1 2 551 9.2 13 847<br />
South, East <strong>and</strong> South-East Asia 2.9 67 059 0.5 75 064 1.5 17 732 0.8 159 855<br />
South, East <strong>and</strong> South-East Asia less China 2.8 59 196 0.3 58 871 1.0 13 143 0.7 131 210<br />
Oceania 5.6 733 -0.2 1 135 -0.7 606 -0.6 2 468<br />
Countries in Central <strong>and</strong> Eastern Europe -0.5 61 794 -2.3 20 840 -0.2 16 278 -0.8 98 912<br />
Developed countries 0.5 191 272 0.5 335 611 0.2 104 240 -0.1 631 118<br />
North America -0.2 49 963 -0.3 100 796 -1.3 25 390 -1.1 176 149<br />
Europe 0.6 125 585 1.3 207 625 0.4 57 533 0.5 390 738<br />
Others<br />
Memor<strong>and</strong>um<br />
3.2 15 724 -1.0 27 190 4.0 21 317 -0.2 64 231<br />
Developing countries less China -0.2 400 187 -0.6 150 665 -0.6 51 206 0.2 601 468<br />
Least developed countries 2.7 13 387 -3.9 6 326 -6.5 1 593 -3.2 21 306<br />
12<br />
10<br />
8<br />
6<br />
4<br />
2<br />
0<br />
9.7<br />
11.4<br />
33.7<br />
40.4<br />
21.0<br />
9.8<br />
54.3<br />
Minerals <strong>and</strong> metals (%)<br />
64.1<br />
3.6<br />
9.5<br />
8.8<br />
Agricultural products (%)<br />
1966 1968 1970 1972 1974 1976 1978 1980 1982 1984 1986 1988 1990 1992 1994 1996 1998 2000<br />
11.5<br />
13.4<br />
0.2<br />
13.7<br />
16.7<br />
0.2<br />
4.0<br />
Evolution of market share of commodity aggregates [1]<br />
Average annual growth rate 1966 - 2000 in % <strong>and</strong> 2000 exports in million US$<br />
Share of least developed countries in commodity exports [1]<br />
(in %)<br />
54.3<br />
59.1<br />
5.2<br />
14.9<br />
13.7<br />
6.9<br />
0.4<br />
9.8<br />
12.9<br />
9.2<br />
13.3<br />
0.3<br />
Fuels<br />
Developing Africa<br />
Developing America<br />
Developing Asia<br />
Developing Oceania<br />
Central <strong>and</strong> Eastern Europe<br />
Developed countries<br />
Agricultural products<br />
Minerals <strong>and</strong> metals<br />
All commodities<br />
79


