

Development and Globalization: - Unctad
Development and Globalization: - Unctad
Development and Globalization: - Unctad

You also want an ePaper? Increase the reach of your titles
YUMPU automatically turns print PDFs into web optimized ePapers that Google loves.
80<br />
70<br />
60<br />
50<br />
40<br />
30<br />
20<br />
10<br />
0<br />
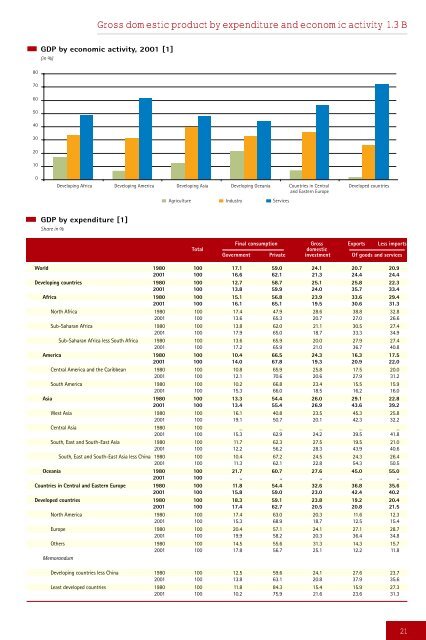
Gross domestic product by expenditure <strong>and</strong> economic activity 1.3 B<br />
GDP by economic activity, 2001 [1]<br />
(in %)<br />
Developing Africa Developing America Developing Asia Developing Oceania Countries in Central<br />
<strong>and</strong> Eastern Europe<br />
GDP by expenditure [1]<br />
Share in %<br />
Agriculture Industry Services<br />
Developed countries<br />
Final consumption Gross Exports Less imports<br />
Total domestic<br />
Government Private investment Of goods <strong>and</strong> services<br />
World 1980 100 17.1 59.0 24.1 20.7 20.9<br />
2001 100 16.6 62.1 21.3 24.4 24.4<br />
Developing countries 1980 100 12.7 58.7 25.1 25.8 22.3<br />
2001 100 13.8 59.9 24.0 35.7 33.4<br />
Africa 1980 100 15.1 56.8 23.9 33.6 29.4<br />
2001 100 16.1 65.1 19.5 30.6 31.3<br />
North Africa 1980 100 17.4 47.9 28.6 38.8 32.8<br />
2001 100 13.6 65.3 20.7 27.0 26.6<br />
Sub-Saharan Africa 1980 100 13.8 62.0 21.1 30.5 27.4<br />
2001 100 17.9 65.0 18.7 33.3 34.9<br />
Sub-Saharan Africa less South Africa 1980 100 13.6 65.9 20.0 27.9 27.4<br />
2001 100 17.2 65.9 21.0 36.7 40.8<br />
America 1980 100 10.4 66.5 24.3 16.3 17.5<br />
2001 100 14.0 67.8 19.3 20.9 22.0<br />
Central America <strong>and</strong> the Caribbean 1980 100 10.8 65.9 25.8 17.5 20.0<br />
2001 100 12.1 70.6 20.6 27.9 31.2<br />
South America 1980 100 10.2 66.8 23.4 15.5 15.9<br />
2001 100 15.3 66.0 18.5 16.2 16.0<br />
Asia 1980 100 13.3 54.4 26.0 29.1 22.8<br />
2001 100 13.4 55.4 26.9 43.6 39.2<br />
West Asia 1980 100 16.1 40.8 23.5 45.3 25.8<br />
2001 100 19.1 50.7 20.1 42.3 32.2<br />
Central Asia 1980 100 _ _ _ _ _<br />
2001 100 15.3 62.9 24.2 39.5 41.8<br />
South, East <strong>and</strong> South-East Asia 1980 100 11.7 62.3 27.5 19.5 21.0<br />
2001 100 12.2 56.2 28.3 43.9 40.6<br />
South, East <strong>and</strong> South-East Asia less China 1980 100 10.4 67.2 24.5 24.3 26.4<br />
2001 100 11.3 62.1 22.8 54.3 50.5<br />
Oceania 1980 100 21.7 60.7 27.6 45.0 55.0<br />
2001 100 .. .. .. .. ..<br />
Countries in Central <strong>and</strong> Eastern Europe 1980 100 11.8 54.4 32.6 36.8 35.6<br />
2001 100 15.8 59.0 23.0 42.4 40.2<br />
Developed countries 1980 100 18.3 59.1 23.8 19.2 20.4<br />
2001 100 17.4 62.7 20.5 20.8 21.5<br />
North America 1980 100 17.4 63.0 20.3 11.6 12.3<br />
2001 100 15.3 68.9 18.7 12.5 15.4<br />
Europe 1980 100 20.4 57.1 24.1 27.1 28.7<br />
2001 100 19.9 58.2 20.3 36.4 34.8<br />
Others 1980 100 14.5 55.6 31.3 14.3 15.7<br />
2001 100 17.8 56.7 25.1 12.2 11.8<br />
Memor<strong>and</strong>um<br />
Developing countries less China 1980 100 12.5 59.6 24.1 27.6 23.7<br />
2001 100 13.8 63.1 20.8 37.9 35.6<br />
Least developed countries 1980 100 11.8 84.3 15.4 15.9 27.3<br />
2001 100 10.2 75.9 21.6 23.6 31.3<br />
21


