

Development and Globalization: - Unctad
Development and Globalization: - Unctad
Development and Globalization: - Unctad

Create successful ePaper yourself
Turn your PDF publications into a flip-book with our unique Google optimized e-Paper software.
100<br />
90<br />
80<br />
70<br />
60<br />
50<br />
40<br />
30<br />
20<br />
10<br />
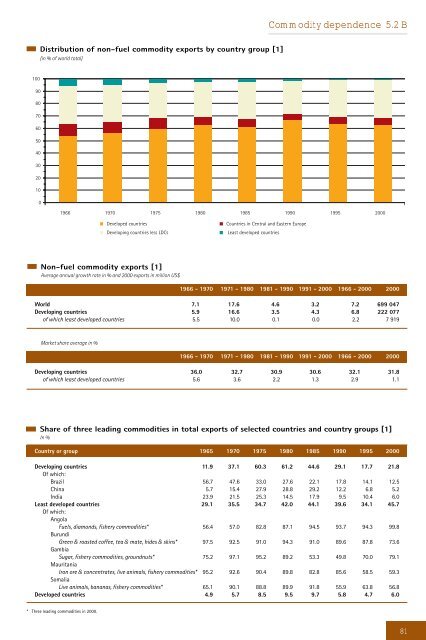
Distribution of non-fuel commodity exports by country group [1]<br />
(in % of world total)<br />
0<br />
Commodity dependence 5.2 B<br />
1966 1970 1975 1980 1985 1990 1995 2000<br />
Developed countries Countries in Central <strong>and</strong> Eastern Europe<br />
Developing countries less LDCs Least developed countries<br />
Non-fuel commodity exports [1]<br />
Average annual growth rate in % <strong>and</strong> 2000 exports in million US$<br />
1966 - 1970 1971 - 1980 1981 - 1990 1991 - 2000 1966 - 2000 2000<br />
World 7.1 17.6 4.6 3.2 7.2 699 047<br />
Developing countries 5.9 16.6 3.5 4.3 6.8 222 077<br />
of which least developed countries 5.5 10.0 0.1 0.0 2.2 7 919<br />
Market share average in %<br />
1966 - 1970 1971 - 1980 1981 - 1990 1991 - 2000 1966 - 2000 2000<br />
Developing countries 36.0 32.7 30.9 30.6 32.1 31.8<br />
of which least developed countries 5.6 3.6 2.2 1.3 2.9 1.1<br />
Share of three leading commodities in total exports of selected countries <strong>and</strong> country groups [1]<br />
In %<br />
Country or group 1965 1970 1975 1980 1985 1990 1995 2000<br />
Developing countries 11.9 37.1 60.3 61.2 44.6 29.1 17.7 21.8<br />
Of which:<br />
Brazil 56.7 47.6 33.0 27.6 22.1 17.8 14.1 12.5<br />
China 5.7 15.4 27.9 28.8 29.2 12.2 6.8 5.2<br />
India 23.9 21.5 25.3 14.5 17.9 9.5 10.4 6.0<br />
Least developed countries 29.1 35.5 34.7 42.0 44.1 39.6 34.1 45.7<br />
Of which:<br />
Angola<br />
Fuels, diamonds, fishery commodities* 56.4 57.0 82.8 87.1 94.5 93.7 94.3 99.8<br />
Burundi<br />
Green & roasted coffee, tea & mate, hides & skins* 97.5 92.5 91.0 94.3 91.0 89.6 87.8 73.6<br />
Gambia<br />
Sugar, fishery commodities, groundnuts* 75.2 97.1 95.2 89.2 53.3 49.8 70.0 79.1<br />
Mauritania<br />
Iron ore & concentrates, live animals, fishery commodities* 95.2 92.6 90.4 89.8 82.8 85.6 58.5 59.3<br />
Somalia<br />
Live animals, bananas, fishery commodities* 65.1 90.1 88.8 89.9 91.8 55.9 63.8 56.8<br />
Developed countries 4.9 5.7 8.5 9.5 9.7 5.8 4.7 6.0<br />
* Three leading commodities in 2000.<br />
81


