

Development and Globalization: - Unctad
Development and Globalization: - Unctad
Development and Globalization: - Unctad

You also want an ePaper? Increase the reach of your titles
YUMPU automatically turns print PDFs into web optimized ePapers that Google loves.
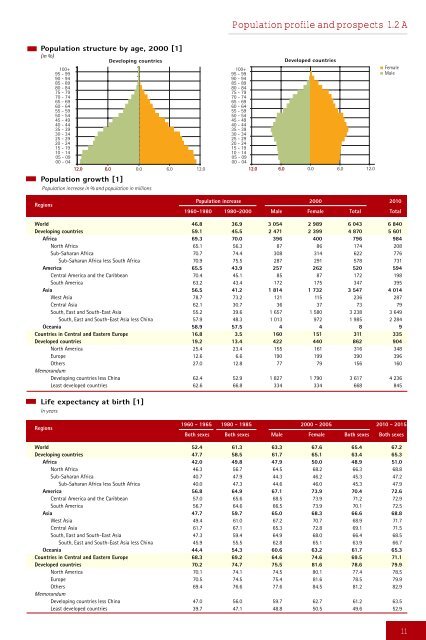
Population structure by age, 2000 [1]<br />
(in %)<br />
Developing countries<br />
100+<br />
95 - 99<br />
90 - 94<br />
85 - 89<br />
80 - 84<br />
75 - 79<br />
70 - 74<br />
65 - 69<br />
60 - 64<br />
55 - 59<br />
50 - 54<br />
45 - 49<br />
40 - 44<br />
35 - 39<br />
30 - 34<br />
25 - 29<br />
20 - 24<br />
15 - 19<br />
10 - 14<br />
05 - 09<br />
00 - 04<br />
12.0 6.0 0.0 6.0 12.0<br />
Population growth [1]<br />
Population increase in % <strong>and</strong> population in millions<br />
Regions<br />
Population profile <strong>and</strong> prospects 1.2 A<br />
Developed countries<br />
100+<br />
95 - 99<br />
90 - 94<br />
85 - 89<br />
80 - 84<br />
75 - 79<br />
70 - 74<br />
65 - 69<br />
60 - 64<br />
55 - 59<br />
50 - 54<br />
45 - 49<br />
40 - 44<br />
35 - 39<br />
30 - 34<br />
25 - 29<br />
20 - 24<br />
15 - 19<br />
10 - 14<br />
05 - 09<br />
00 - 04<br />
12.0 6.0 0.0 6.0 12.0<br />
Female<br />
Male<br />
Population increase 2000 2010<br />
1960-1980 1980-2000 Male Female Total Total<br />
World 46.8 36.9 3 054 2 989 6 043 6 840<br />
Developing countries 59.1 45.5 2 471 2 399 4 870 5 601<br />
Africa 69.3 70.0 396 400 796 984<br />
North Africa 65.1 56.3 87 86 174 208<br />
Sub-Saharan Africa 70.7 74.4 308 314 622 776<br />
Sub-Saharan Africa less South Africa 70.9 75.5 287 291 578 731<br />
America 65.5 43.9 257 262 520 594<br />
Central America <strong>and</strong> the Caribbean 70.4 45.1 85 87 172 198<br />
South America 63.2 43.4 172 175 347 395<br />
Asia 56.5 41.2 1 814 1 732 3 547 4 014<br />
West Asia 78.7 73.2 121 115 236 287<br />
Central Asia 62.1 30.7 36 37 73 79<br />
South, East <strong>and</strong> South-East Asia 55.2 39.6 1 657 1 580 3 238 3 649<br />
South, East <strong>and</strong> South-East Asia less China 57.9 48.3 1 013 972 1 985 2 284<br />
Oceania 58.9 57.5 4 4 8 9<br />
Countries in Central <strong>and</strong> Eastern Europe 16.8 3.5 160 151 311 335<br />
Developed countries 19.2 13.4 422 440 862 904<br />
North America 25.4 23.4 155 161 316 348<br />
Europe 12.6 6.6 190 199 390 396<br />
Others 27.0 12.8 77 79 156 160<br />
Memor<strong>and</strong>um<br />
Developing countries less China 62.4 52.9 1 827 1 790 3 617 4 236<br />
Least developed countries 62.6 66.8 334 334 668 845<br />
Life expectancy at birth [1]<br />
In years<br />
Regions<br />
1960 - 1965 1980 - 1985 2000 - 2005 2010 - 2015<br />
Both sexes Both sexes Male Female Both sexes Both sexes<br />
World 52.4 61.3 63.3 67.6 65.4 67.2<br />
Developing countries 47.7 58.5 61.7 65.1 63.4 65.3<br />
Africa 42.0 49.8 47.9 50.0 48.9 51.0<br />
North Africa 46.3 56.7 64.5 68.2 66.3 68.8<br />
Sub-Saharan Africa 40.7 47.9 44.3 46.2 45.3 47.2<br />
Sub-Saharan Africa less South Africa 40.0 47.3 44.6 46.0 45.3 47.9<br />
America 56.8 64.9 67.1 73.9 70.4 72.6<br />
Central America <strong>and</strong> the Caribbean 57.0 65.6 68.5 73.9 71.2 72.9<br />
South America 56.7 64.6 66.5 73.9 70.1 72.5<br />
Asia 47.7 59.7 65.0 68.3 66.6 68.8<br />
West Asia 49.4 61.0 67.2 70.7 68.9 71.7<br />
Central Asia 61.7 67.1 65.3 72.8 69.1 71.5<br />
South, East <strong>and</strong> South-East Asia 47.3 59.4 64.9 68.0 66.4 68.5<br />
South, East <strong>and</strong> South-East Asia less China 45.9 55.5 62.8 65.1 63.9 66.7<br />
Oceania 44.4 54.3 60.6 63.2 61.7 65.3<br />
Countries in Central <strong>and</strong> Eastern Europe 68.3 69.2 64.6 74.6 69.5 71.1<br />
Developed countries 70.2 74.7 75.5 81.6 78.6 79.9<br />
North America 70.1 74.1 74.5 80.1 77.4 78.5<br />
Europe 70.5 74.5 75.4 81.6 78.5 79.9<br />
Others 69.4 76.6 77.6 84.5 81.2 82.9<br />
Memor<strong>and</strong>um<br />
Developing countries less China 47.0 56.0 59.7 62.7 61.2 63.5<br />
Least developed countries 39.7 47.1 48.8 50.5 49.6 52.9<br />
11


